Solana Down 5% — Charts Now Show A Clear Path Toward The $130 Danger Zone
Author: Parshwa Turakhiya | November 13, 2025 03:07pm
Solana (CRYPTO: SOL) fell about 5% on Thursday as the token slipped deeper into a multi-week downtrend.
Sellers Press Price Below $150 Support
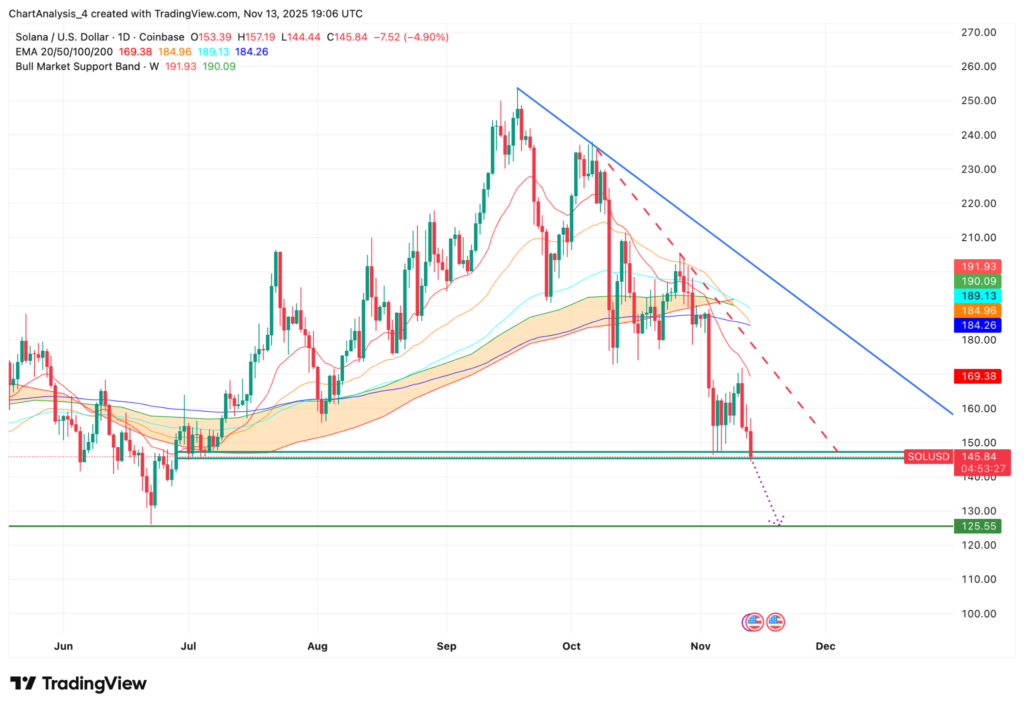
SOL Price Dynamics (Source: TradingView)
Solana broke below the $150 level after failing to hold the mid-range support that marked the market's July floor.
Price has now returned to the $144–$148 demand zone, which remains the last high-volume shelf before the chart opens toward deeper support near $130.
A descending trendline from the September high continues to guide each lower high.
The latest rejection at the EMA band between $168 and $185 reinforced that ceiling and triggered the current leg lower.
Flows Turn Negative As Outflows Mount
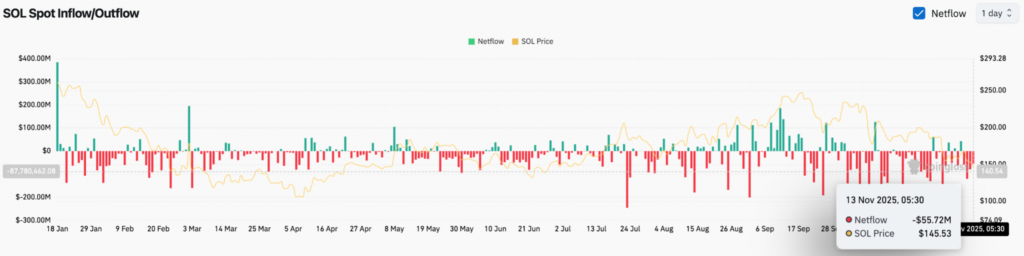
SOL Netflows (Source: Coinglass)
According to Coinglass, Solana saw net outflows of almost $56 million on Nov. 13, extending a multi-week run of red prints.
Outflows have dominated since mid-August and have matched each strong downside move.
Investors tracking liquidity patterns may see these readings as confirmation that the trend remains heavy.
Short-Term Signals Show Continued Weakness

SOL Price Analysis (Source: TradingView)
On the 30-minute chart, Solana fell below the Supertrend line after the indicator flipped bearish near $157.
The breakdown sent volatility higher and pushed RSI toward oversold conditions near 19.
Oversold readings can trigger brief relief bounces, but the short-term bias stays negative unless price regains the $151–$153 area.
Failure to reclaim that zone keeps sellers in control of intraday momentum.
Read Next:
Image: Shutterstock
Posted In: $SOL


