4 Winners To Consider Selling As Markets Get Volatile
Author: Benzinga Research Team | November 14, 2025 12:38pm
Major U.S. indices have experienced severe volatility over the last few weeks, but the motion has gone both ways: roaring up days followed by thunderous declines. However, for the most part, markets have hung within 2-3% of their all-time highs, and the long-awaited correction has yet to materialize in the broader indices.
While the S&P 500 has avoided a correction for more than six months now, specific sectors and individual stocks haven't been so lucky. And neither megacaps nor small-caps have been spared.
How to Trade as Volatility Returns As The Government Reopens
With Washington opening back up and the backlog of data about to drop, traders are entering another high-risk, high-reward stretch. Each new data report or Fed update could swing markets fast, and Matt Maley is preparing for it now. Join him Sunday, November 16, at 1 PM ET for a live strategy session covering the setups, indicators, and risk-management tools he's using to trade this uncertain window before October's Fed minutes are released. Join the Free Session
Meta Platforms Inc. (NASDAQ:META) is in full correction mode, down 20% from its previous all-time high, and speculative industries like quantum computing and nuclear energy have gotten hammered over the last two weeks.
Is this the beginning of the end for the AI-induced bull market? Unlikely, considering how much capex is still being devoted to data centers and AI infrastructure. But no one ever went broke taking profits, and some of 2025's biggest winners are starting to look a little tired.
Oracle Corp.
Few stocks made more headlines this summer than Oracle (NASDAQ:ORCL), which inked a partnership with OpenAI worth more than $300 billion over five years. This deal was a catalyst for Oracle shares, which jumped more than 35% in a single day; an astonishing move for a company with a market cap north of $600 billion. But since the deal was finalized, speculation has arisen about the specifics of the arrangement, especially the debt Oracle is financing to provide capacity. Additionally, Oracle's valuation is exceedingly expensive. The stock now trades at 52 times earnings and more than 8 times book value.
After nearly doubling in price between April and September, ORCL shares appear to have reached a peak, at least in the short term. The stock price has plunged below the 50-day simple moving average (SMA), closing the gap from the 35% one-day surge when the OpenAI deal was announced. The Moving Average Convergence Divergence (MACD) indicator also shows bearish momentum building, and the 200-day SMA will be a key area to watch in the subsequent few sessions. If ORCL shares take out the 200-day SMA, the bottom could be far below current levels.
Pagaya Technologies Ltd.
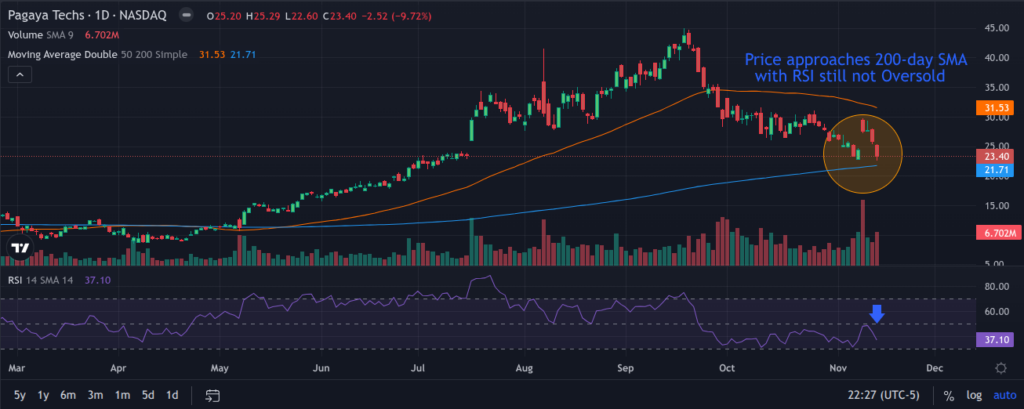
Pagaya Tech (NASDAQ:PGY) is a mid-cap financial firm that provides AI and machine learning systems to banks and asset managers. The company has a market cap of $1.88 billion and generates about $1 billion in annual sales. However, despite a top- and bottom-line beat, the company warned of credit impairment charges in its Q3 earnings report released on November 10. PGY shares rose 12% in the day following the report, but immediately gave those gains back in the subsequent two sessions.
After using the 50-day SMA as support for most of Q2 and Q3, PGY shares breached it in September and immediately declined by more than 25% over just under two weeks. The stock is still up more than 150% year-to-date (YTD), but this recent decline has investors on edge. Like Oracle, the 200-day SMA will be a battleground for bulls and bears, but the Relative Strength Index (RSI) isn't flashing Oversold yet, a hint that the next move could be downward again.
Robinhood Markets Inc.
Sell Robinhood(NASDAQ:HOOD)? Say it isn't so! HOOD has been one of 2025's biggest outperformers, up more than 225% YTD on the back of multiple earnings beats and catalysts. Robinhood is reporting record revenue from crypto and options trading, and recently entered the world of prediction markets through a partnership with Kalshi. The company posted Q3 earnings earlier this month and reported more than $1.27 billion in revenue, a 100% YOY increase. Earnings per share (EPS) tripled YOY from $0.17 to $0.61.
Robinhood is still likely in good shape for long-term investors, but the short-term picture is looking murky. Crypto revenue is a crucial component of the company's sales, and the primary tokens like Bitcoin and Ethereum have traded basically flat on the year. The stock also hugged the 50-day SMA tightly for most of 2025, but recently dipped below it for the first time since April. The RSI also shows downward trending momentum, so taking profits might be advisable here, especially if speculative assets continue to flounder.
Oklo Inc.
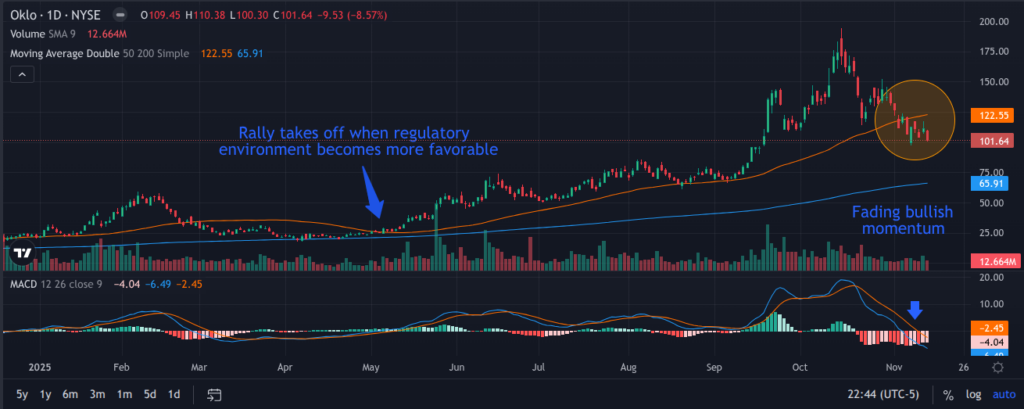
The nuclear revolution might not be as imminent as the Trump administration wants. After the One Big Beautiful Bill Act (OBBBA) was passed in April, which included many subsidies and benefits for nuclear power, companies like Oklo Inc. (NASDAQ:OKLO) saw their stock prices soar to unprecedented highs. OKLO shares went from $20 to $170 between April and October, but one crucial thing was missing from this rally: revenue. Oklo specializes in small modular reactors (SMRs), which (in theory) are more efficient because they can be built faster and scaled to various enterprises. Energy demand continues to grow exponentially as data centers grow hungrier, and nuclear energy is being prioritized over other forms of clean power. But despite these macro tailwinds, Oklo has yet to sell or install any reactors, and its losses continue to mount.
OKLO reported Q3 earnings on November 11th and missed expectations again, posting a loss of $0.20 per share, below the consensus analyst estimate of $0.13 per share. The company's most promising future projects aren't expected to generate revenue until late 2027 or early 2028, which is a long time for investors to wait for the potential of profits. Some appear to be getting restless, as the stock is down 40% in the last 30 days alone, and recently took out a key support level at the 50-day SMA. A classic ‘head and shoulders' pattern began forming in early September, and the stock has now broken below the ‘neckline' level that signifies a bearish trend. A bearish MACD crossover confirms this trend, and it may be a while before Oklo regains the momentum it had this summer.
Editorial content from our expert contributors is intended to be information for the general public and not individualized investment advice. Editors/contributors are presenting their individual opinions and strategies, which are neither expressly nor impliedly approved or endorsed by Benzinga.