Gold Doubled to $4,000, Mining Valuations Didn't: 3 Top Stocks To Consider
Author: Luis Flavio Nunes | November 17, 2025 08:28am
If you only looked at price charts, you’d think everyone loves gold miners right now.
GDX doubled. GDXJ doubled. Spot gold broke above $4,000, capping a year of record-setting gains.
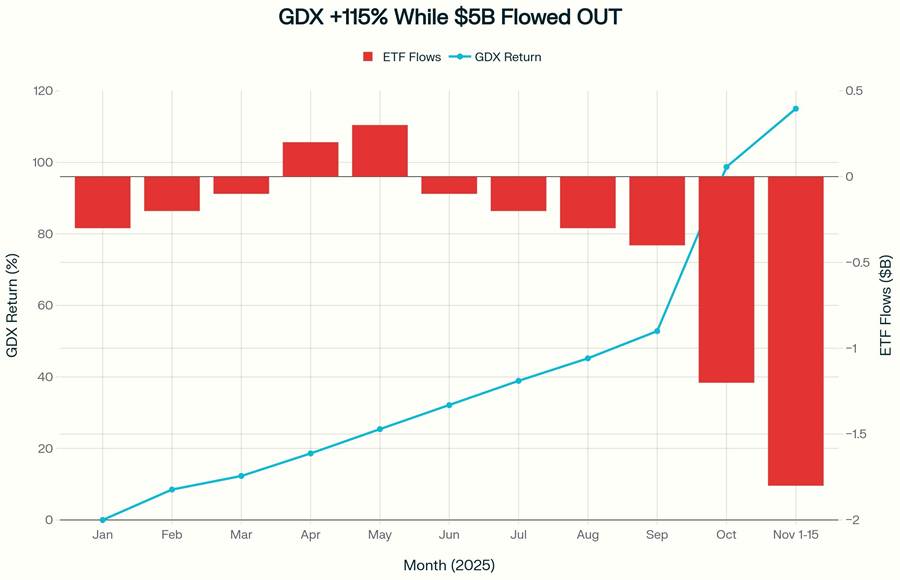
And while miners climbed 115%, roughly $5 billion walked out of mining ETFs. The biggest outflows happened in October, right as prices peaked. That’s the opposite of what happens in blow-off tops. It’s what happens when institutions take profits and retail hasn’t caught up yet.
This means that the mining trade isn’t overcrowded. It’s under-owned. And with central banks hoarding 24-29% of global gold supply annually while mine output grows just 1%, the structural squeeze is still in the early innings. Here’s how to play it with three specific setups, defined stops, and a thesis that doesn’t require predicting the top.
The Setup: Price Says “Bull,” Flows Say “Not Yet”
Gold prices have climbed to historic highs around $4,000 an ounce on October 8, 2025. The SPDR Gold Shares ETF, (NYSE:GLD), sits near $375.96, up roughly 53% year‑to‑date. Meanwhile, the VanEck Gold Miners ETF (NYSE:GDX) has climbed from $35.34 to $76.16, a 115% YTD gain, and (NYSE:GDXJ), the junior miners ETF, is up around 117% over the same period.
That is about 2.3x the return of physical gold.
In this cycle, gold is the engine, and the miners are the turbocharger. They do not move without the engine, but once it revs, they multiply the power. That amplification works in both ways. The same math that turns a 50% move in gold into a 115% move in miners can turn a 15% gold correction into 25–35% drawdowns in the equities. This is not a safe‑money trade. It is a geared way to express a supply–demand imbalance.
You can see the amplification in the spread between miners and the metal. The GDX/GLD ratio has improved from 0.1440 to 0.2026 in 2025, a 40.7% jump in favor of miners. On price alone, the sector looks like a late‑stage leader in a bull market.
The flows tell a different story.
Over the past year, GDX absorbed nearly $3 billion in net outflows, with heavy selling pressure through late 2024 and early 2025. World Gold Council data show that physically backed gold ETFs added about 638 tonnes in 2025, bringing total holdings to 3,857 tonnes, still 2% below the 2020 peak even as prices moved sharply higher. At the same time, GDXJ recorded about $2 billion in net outflows, yet the ETF kept climbing.
Put simply, roughly $5 billion left mining ETFs while prices rose 115%. In a typical bull, capital chases performance. Here, capital has been leaving even as the trade worked. That looks more like institutions taking profits into strength and a broader market still unconvinced by the move.
In classic bubbles you tend to see parabolic prices, parabolic inflows, exploding share counts, and sentiment surveys stacked with bulls. Here you have a different mix:
Triple‑digit gains in miners, with about $5 billion in redemptions and shrinking ETF share counts.
That combination, price strength with skeptical flows, lines up more with a market that many investors still do not trust than with a blow‑off top.
GDX +115% YTD While $5 Billion Flowed OUT. Peak outflows occurred during peak price gains (October), indicating institutional profit-taking into strength, not euphoric inflows
Why This Time Is Different: The Central Bank Bid
Gold at $4,000 is not driven by online frenzy. The main force acting is central banks changing how they hold reserves.
Multiple sources, including the World Gold Council and VanEck, point to the same pattern. Central banks have become consistent net buyers of gold. Since 2022, they have purchased over 1,000 tonnes of gold per year, roughly double the average of the prior decade. Emerging markets, led by China, Poland, Turkey, and Kazakhstan, are driving most of this buying as they diversify away from the dollar.
The 2025 numbers stand out even inside that trend. Through September, central banks added about 634 tonnes, with full‑year purchases forecast between 750 and 900 tonnes. That would make 2025 one of the strongest official buying years on record.
On the supply side, the story is much slower. Global mine supply is expected to grow only about 1% in 2025. At current production rates of roughly 3,100 tonnes per year, official buyers taking 750–900 tonnes are effectively absorbing 24–29% of annual output before taking jewelry, technology, and private investment into account.
The industry cannot easily accelerate to meet that demand. Producers face higher energy and labor costs, declining ore grades that require moving more rock for the same ounces, and permitting processes that can drag on for years. The United States has not opened a new gold mine since 2002, which gives you a sense of how slow the supply response can be.
A simple picture helps. Imagine a stadium with fixed seating. Central banks are buying up rows of seats. The rest of the market is only now noticing that the venue keeps filling, but no one can add new sections. If you are a retail investor, you cannot buy the whole stadium. What you can buy is the ticket booth that earns money every time the crowd turns up.
Gold ETFs give you exposure to the bars in the vault. Central banks buy those bars, not equity. The place where individual investors can link themselves to heavy official buying, tight new supply, and a slow change in the reserve system is in the mining stocks.
VanEck notes that gold miners have risen over 120% year‑to‑date and still look cheap relative to the metal. In other words, the gold market has moved into a new price range faster than many miners have reacted.
The Technical Picture: Miners Peaked Early, But Support Is Holding
Short term, the charts show a bull that is pausing rather than one that has broken down.
GDX peaked on October 16 at $84.44 and has since eased back to about $76.16, a decline of roughly 9.8%. GLD hit its high a few days later, on October 20, at $403.15, and now sits about 6.7% below that level. Over the last 30 days, GDX is down approximately 3.1% while GLD is up 3.2%.
On a price chart, that sequence, miners topping first, then slipping while gold grinds higher, can look like the start of a rollover. When you add the flow data and the central‑bank demand, it also looks like early participants taking profits in a group that just doubled while the underlying metal holds near $3,900–$4,000.
The way this pullback unfolded matters. GDX moved from its October 16 high down to the $76 area in about four weeks. In the last major gold bull in 2011, miners often needed six months or more to recover from corrections, and important support levels did not hold.
The difference today is that the central bank buying is structural and accelerating, not cyclical and fading. In 2011, official buyers were net sellers. That’s why the 2011 top was real, and why this pullback may not be.
Key support levels are still intact. Intermediate support sits around $59.51, roughly the midpoint of the 2025 range, while deeper support lies near $34.58. Neither area has been seriously challenged in this latest move.
If this were the end of the move, you would expect gold and miners to be breaking down together, with sharp outflows from both metal and equity ETFs and a fast compression in valuations. Instead, miners are consolidating while gold stays firm.
For traders who like to be early, this kind of pullback can be a place to start building positions with defined risk rather than a reason to walk away.
The Three‑Tier Playbook: How to Trade the Miners
For retail traders, the question is not whether gold is atractive at $4,000. It clearly is. The question is how to get exposure to the earnings power of miners without taking on more risk than you can handle.
One way to do that is to focus on miners that:
benefit from a higher and more stable gold price through strong balance sheets, long‑life assets, and clear free‑cash‑flow upside, and
have a path to grow production or margins in a $3,800–$4,000 environment.
The examples below use current data to illustrate how such a portfolio might look. The position sizes and exact entry levels should still match your own risk rules.
Newmont (NEM) trades around $87.80, on about 13.65x earnings, with a 64.8% gain so far this year. Among the large miners, it is the closest thing to a blue‑chip name: a broad asset base, diverse operations, and the lowest P/E multiple in its peer group.
The historical comparison puts that valuation in context. In 2011, at the last major gold peak, large miners often traded at 20–30x earnings with gold near $1,800. Today, with gold around $4,000, many miners sit between 13–25x. The metal has more than doubled while the multiples are 20–30% lower.
At $3,800–$4,000 gold, Newmont generates meaningful free cash flow. That cash can support dividends and buybacks while central banks continue to add to their reserves. For traders who see this gold move as more than a short‑term spike, NEM is the ticket booth in the earlier analogy.
A workable way to approach the trade is to look for entries around $87–$88, or on a dip into the $82–$85 zone, with a stop near $76 just below the 200‑day moving average. That setup risks roughly 13% on the position. A first target around $105 assumes gold holds near $3,900–$4,000 and miners re‑rate to reflect the new earnings profile.
Tier 2 – Momentum with Room: Barrick Mining (NYSE:B)
Barrick has already moved sharply, from lower levels to $37.03, for a 107.95% gain this year, yet the stock still trades at about 17.8x earnings. That is well below the multiples that usually accompany true manias.
The stock topped near $51.09 and has since pulled back to the $37 area, about a 27% retracement. In the context of a strong bull market, that looks more like profit‑taking than a lasting top. Technically, the trend is still healthy. The 50‑day moving average sits near $32.84, and the 200‑day near $23.45.
If Western investors begin to rotate from gold ETFs like GLD back into mining equities, Barrick is an obvious candidate for new institutional money. It has the liquidity, size, and coverage that big funds look for when they want exposure to the group.
One way to frame the trade is to use an entry around $37, with more cautious buyers waiting for a pullback toward $34 above the 50‑day, and a stop around $30 near the 200‑day. That implies roughly 19% downside to the stop, with a first target near $45 and a possible retest of $51 if gold pushes higher into 2026.
Agnico Eagle (AEM) is the "pay up for quality" choice. At around $168.11, it trades on roughly 24.58x earnings, with a 94.78% gain year‑to‑date. That multiple is higher than NEM or Barrick, but Agnico earns it through strong operations, favorable jurisdictions, and a pipeline that can grow production in a market where global mine supply is barely increasing.
The stock peaked near $263.23 and has since given back about 11%, with the 50‑day moving average around $163.48 acting as a key support area. In a group where very few miners can genuinely increase ounces and expand margins, AEM stands out.
For traders comfortable paying a premium for quality, an entry around $168, or on a bounce that holds above $165, with a stop near $155 (about 7% downside) can make sense. A first target around $200, with longer‑term potential back toward the prior $260+ area if gold remains elevated and the company delivers on its plans, reflects both the growth and the valuation.
Franco‑Nevada (FNV) is a streaming and royalty company, which naturally justifies a higher multiple than many producers. At around $196.96, however, it trades on roughly 41.29x earnings. In a sector where NEM, B, and AEM offer strong gold exposure and much lower P/E ratios, that kind of pricing looks full for new positions.
If you already own FNV, it can make sense to hold it with tighter risk controls. For fresh capital, it may be more attractive to wait for a 20% or greater pullback or a clear reset in expectations.
Risk Management: What If Gold Drops 15%?
Everything here still comes back to one fact: miners are a geared way to own gold. The same operational leverage that delivered 115% gains in GDX this year can work against you just as hard.
It is worth running basic downside math. If gold moves from roughly $4,000 to $3,400, about a 15% decline, history suggests you could see GDX down 25–35%, into the $49–$57 range. GDXJ could fall 40–50%, into the $49–$58 band. GLD, tracking the metal, would likely be off about 15%, toward $320.
The way to live through that without panic‑selling at the bottom is not a slogan; it is position sizing and pre‑defined exits.
For large‑cap miners like NEM and B, that usually means 2–3% of your total portfolio per name, with stops decided in advance. For premium growth names like AEM, 1–2% is more appropriate, again with tighter stops. Junior exposure through something like GDXJ is where you keep it small, roughly 0.5–1%, and only if you are genuinely comfortable with big swings.
Thinking in dollar risk rather than percentages helps. A $5,000 position in NEM with a 13% stop risks about $650. A $20,000 position with that same stop risks $2,600. At $650, many traders can stay calm and follow their plan. At $2,600, far more start second‑guessing themselves.
If NEM stops out at $76, a roughly $5,500 position (about 62 shares at $87.80) takes a $650 hit. That is manageable for most accounts. A $50,000 position would drop $6,500, which can force traders to sell other holdings or abandon the trade entirely. Often it is the size, not the thesis, that causes the real damage.
The supply and demand math is what justifies staying interested even if you do take a few hits. Central banks buying 750–900 tonnes a year while mine supply grows only about 1% is not a pattern that turns on a single headline.
In a multi‑year squeeze, pullbacks are often the moments when disciplined buyers quietly add.
Quick Reference: Three-Tier Setup
Ticker
Entry
Stop
Target
Position Size
Max Risk
NEM
$82-88
$76
$105
2-3%
13%
B
$34-37
$30
$45-51
2-3%
19%
AEM
$165-168
$155
$200+
1-2%
7%
Next Catalyst: December FOMC meeting Key Level to Watch: Gold support at $3,900
Bottom Line: The Trade Isn’t Over
For retail traders looking at gold and miners today, a few points matter more than the noise.
First, GDX is up more than 115% year‑to‑date, but roughly $5 billion in ETF outflows show that many investors still do not trust the move. Second, central banks have become the largest and most consistent gold buyers in the world, adding 750–900 tonnes per year and steadily reducing their reliance on the dollar. Third, mine supply is barely growing at about 1% annually, and many high‑quality miners are still not priced as if $3,800–$4,000 gold is the new normal.
Taken together, those pieces suggest that the miner trade is shifting from a fast early phase into a longer period driven by policy decisions and tight supply. Retail traders still have room to participate, as long as they do it with a clear plan.
The December FOMC meeting is the next obvious event to watch. If the Fed stays on pause and inflation eases, central banks may feel even more comfortable continuing to add to their gold holdings. If the Fed surprises with a tougher stance, miners could fall 15–20%, which would likely give patient traders better entry points. In either case, the underlying relationship between slow supply growth and steady official demand remains the same.
One reasonable way to act on this is to anchor a core position in Newmont (NEM) around 13.65x earnings, add Barrick (B) and Agnico (AEM) selectively for more upside potential, and size positions so that a 25–35% drawdown in miners is something your portfolio and your nerves can handle.
If gold is the engine and miners are the turbocharger, central banks are the driver keeping it on the throttle. Your job is not to predict the exact moment they ease off. It is to decide how much of that journey you want to be on, and how much volatility you are willing to accept along the way.
This article is for informational and educational purposes only and is not investment advice or a recommendation to buy or sell any security. The author does not hold a position in any securities or assets mentioned.
Benzinga Disclaimer: This article is from an unpaid external contributor. It does not represent Benzinga’s reporting and has not been edited for content or accuracy.