Assessing Amazon.com's Performance Against Competitors In Broadline Retail Industry
Author: Benzinga Insights | November 17, 2025 10:00am
Amidst the fast-paced and highly competitive business environment of today, conducting comprehensive company analysis is essential for investors and industry enthusiasts. In this article, we will delve into an extensive industry comparison, evaluating Amazon.com (NASDAQ:AMZN) in comparison to its major competitors within the Broadline Retail industry. By analyzing critical financial metrics, market position, and growth potential, our objective is to provide valuable insights for investors and offer a deeper understanding of company's performance in the industry.
Amazon.com Background
Amazon is the leading online retailer and marketplace for third party sellers. Retail related revenue represents approximately 74% of total, followed by Amazon Web Services (17%), and advertising services (9%). International segments constitute 22% of Amazon's total revenue, led by Germany, the United Kingdom, and Japan.
| Company |
P/E |
P/B |
P/S |
ROE |
EBITDA (in billions) |
Gross Profit (in billions) |
Revenue Growth |
| Amazon.com Inc |
33.15 |
6.79 |
3.67 |
6.02% |
$45.5 |
$91.5 |
13.4% |
| Alibaba Group Holding Ltd |
17.74 |
2.58 |
2.62 |
4.26% |
$53.52 |
$111.22 |
1.82% |
| PDD Holdings Inc |
14.09 |
3.65 |
3.37 |
8.89% |
$25.79 |
$58.13 |
7.14% |
| MercadoLibre Inc |
50.01 |
16.71 |
3.97 |
7.06% |
$0.88 |
$3.21 |
39.48% |
| Sea Ltd |
61.51 |
8.18 |
4.23 |
3.77% |
$0.48 |
$2.6 |
38.3% |
| Coupang Inc |
134.38 |
10.87 |
1.57 |
2.02% |
$0.32 |
$2.72 |
17.81% |
| JD.com Inc |
9.81 |
1.28 |
0.24 |
2.3% |
$7.36 |
$50.47 |
14.85% |
| eBay Inc |
18.59 |
8.03 |
3.71 |
13.35% |
$0.74 |
$2.0 |
9.47% |
| Vipshop Holdings Ltd |
10.37 |
1.72 |
0.68 |
3.74% |
$1.91 |
$6.05 |
-3.98% |
| Dillard's Inc |
17.26 |
4.84 |
1.51 |
3.86% |
$0.14 |
$0.58 |
1.41% |
| Ollie's Bargain Outlet Holdings Inc |
36.14 |
4.28 |
3.16 |
3.49% |
$0.09 |
$0.27 |
17.49% |
| MINISO Group Holding Ltd |
20.12 |
4.26 |
2.53 |
4.56% |
$0.73 |
$2.2 |
23.07% |
| Macy's Inc |
11.36 |
1.21 |
0.25 |
1.95% |
$0.36 |
$2.1 |
-1.9% |
| Kohl's Corp |
9.01 |
0.48 |
0.12 |
3.97% |
$0.45 |
$1.53 |
-4.98% |
| Hour Loop Inc |
67 |
9.87 |
0.51 |
18.14% |
$0.0 |
$0.02 |
-3.45% |
| Average |
34.1 |
5.57 |
2.03 |
5.81% |
$6.63 |
$17.36 |
11.18% |
Through a meticulous analysis of Amazon.com, we can observe the following trends:
-
With a Price to Earnings ratio of 33.15, which is 0.97x less than the industry average, the stock shows potential for growth at a reasonable price, making it an interesting consideration for market participants.
-
The elevated Price to Book ratio of 6.79 relative to the industry average by 1.22x suggests company might be overvalued based on its book value.
-
The Price to Sales ratio of 3.67, which is 1.81x the industry average, suggests the stock could potentially be overvalued in relation to its sales performance compared to its peers.
-
With a Return on Equity (ROE) of 6.02% that is 0.21% above the industry average, it appears that the company exhibits efficient use of equity to generate profits.
-
With higher Earnings Before Interest, Taxes, Depreciation, and Amortization (EBITDA) of $45.5 Billion, which is 6.86x above the industry average, the company demonstrates stronger profitability and robust cash flow generation.
-
The gross profit of $91.5 Billion is 5.27x above that of its industry, highlighting stronger profitability and higher earnings from its core operations.
-
With a revenue growth of 13.4%, which surpasses the industry average of 11.18%, the company is demonstrating robust sales expansion and gaining market share.
Debt To Equity Ratio
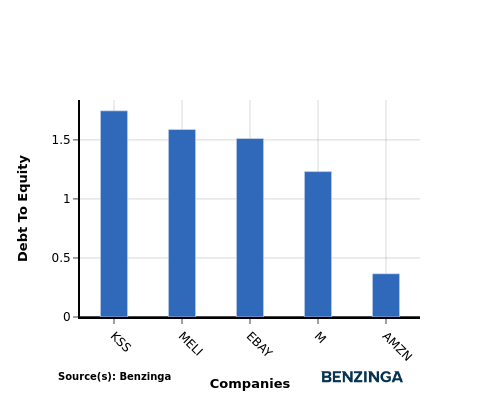
The debt-to-equity (D/E) ratio assesses the extent to which a company relies on borrowed funds compared to its equity.
Considering the debt-to-equity ratio in industry comparisons allows for a concise evaluation of a company's financial health and risk profile, aiding in informed decision-making.
In terms of the Debt-to-Equity ratio, Amazon.com stands in comparison with its top 4 peers, leading to the following comparisons:
-
Amazon.com is in a relatively stronger financial position compared to its top 4 peers, as evidenced by its lower debt-to-equity ratio of 0.37.
-
This implies that the company relies less on debt financing and has a more favorable balance between debt and equity.
Key Takeaways
The low P/E ratio suggests Amazon.com may be undervalued compared to its peers in the Broadline Retail industry. However, the high P/B and P/S ratios indicate that the market values the company's assets and sales more highly. Amazon.com's high ROE, EBITDA, gross profit, and revenue growth reflect strong financial performance relative to industry competitors.
This article was generated by Benzinga's automated content engine and reviewed by an editor.
Posted In: AMZN