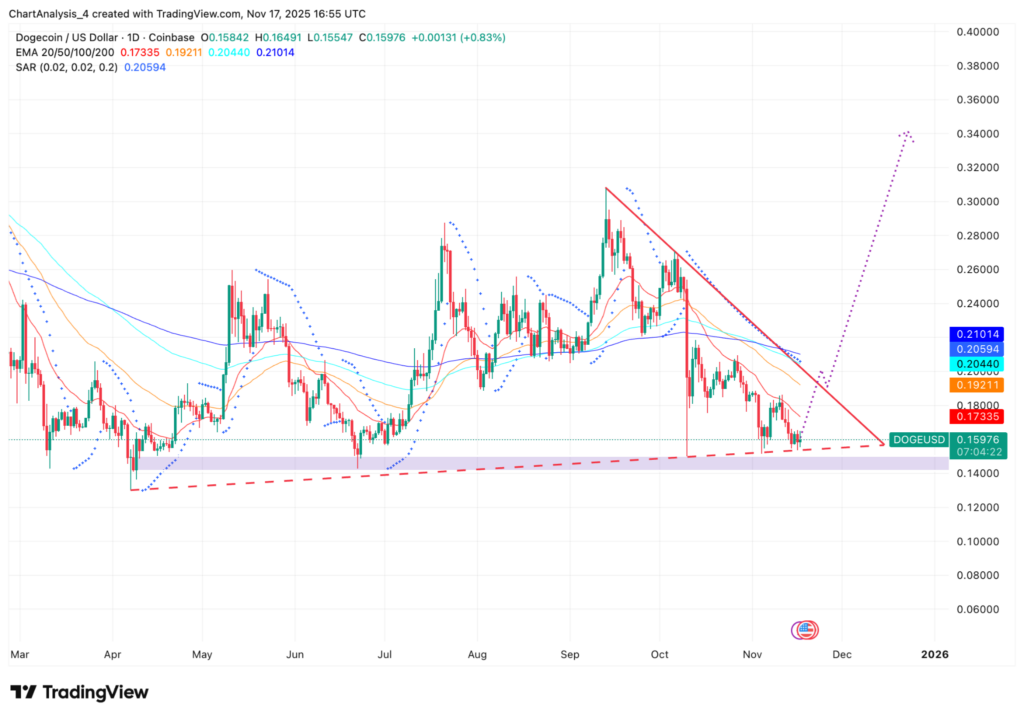
Dogecoin’s price is holding just above the rising support that has generated every major rally since February.
The $0.145 to $0.150 area has consistently acted as a demand zone, absorbing sell pressure during each retest and helping fuel recoveries toward mid-range levels.
The current test comes as broader crypto sentiment remains weak, with Shiba Inu(CRYPTO: SHIB) trading near $0.0000089 after repeated failures at intraday resistance and XRP(CRYPTO: XRP) hovering around $2.18 as it slips back under a key intraday trendline.
Bitcoin(CRYPTO: BTC) also remains under pressure near $93,500, keeping risk appetite muted across the market.
The long-term trendline has never broken during the past 300 days, making it one of the most respected levels among high-liquidity altcoins.
Daily Chart Shows Heavy EMA Pressure
The daily structure shows Dogecoin consolidating between the long-term support floor and overhead moving averages.
The 50-day EMA near $0.19 and the 200-day EMA near $0.21 continue to act as layers of resistance.
Until DOGE closes above the descending trendline around $0.175, momentum will remain limited.
The significance of the rising support remains clear.
The token has tapped this level several times this year without a confirmed breakdown, and each touch has sparked immediate buying.
The latest wick into the zone once again attracted demand, reinforcing the narrative that buyers continue to defend the long-term base.
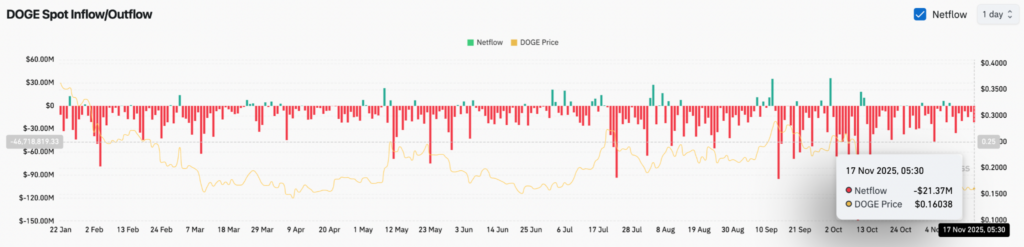
Coinglass data shows continued negative netflows throughout November, including a $21.3 million outflow on Nov. 17.
Traders have been sending DOGE off exchanges, which typically reduces available liquidity and can limit upside reactions.
Outflows can sometimes signal accumulation, but in Dogecoin's case they align with risk-off positioning across major altcoins.
Why It Matters For Investors
Dogecoin is now at one of the most important convergence zones on its chart: a 300-day rising trendline meeting a multi-week descending ceiling.
Breaks from these types of structures tend to be fast and decisive.
A daily close above $0.175 would unlock the next liquidity pocket toward $0.21 at the 200-day EMA.
Historically, Dogecoin accelerates when that level flips to support.
If the breakout holds, the path toward the $0.28 to $0.35 range becomes technically supported by the measured move of the year-long structure.
The downside is equally clear.
A confirmed close below the rising support near $0.145 would invalidate the bullish base that has carried Dogecoin throughout 2025 and expose the $0.13 zone.