ETH Dips Below $3,000 But Tom Lee Predicts It's 'Pretty Close To Bottoming This Week'
Author: Parshwa Turakhiya | November 18, 2025 08:16am
Ethereum (CRYPTO: ETH) is back above $3,000 on Tuesday morning as Fundstrat's Tom Lee predicts it is "pretty close to bottoming this week."
Tom Lee Flags Multiple Signs Ethereum May Be Near A Bottom
Lee on Monday on CNBC said that Ethereum's long-term narrative remains intact despite recent volatility.
He highlighted stablecoin creation, BlackRock's push to tokenize assets and Wall Street's interest in bringing stocks, bonds and real estate on-chain.
He described Ethereum as the only "neutral, 100% uptime blockchain" capable of supporting that shift.
Lee also noted that Ethereum has several ways of forming a structural floor.
One is the ratio between ETH's market value and the value of assets locked on the network.
He said Ethereum historically bottoms when that ratio hits about 50%, adding that current readings are near that level.
A second indicator, Lee said, is Ethereum's ratio to Bitcoin.
He cited an ETH–BTC ratio of 0.032 against an eight-year average that implies a theoretical valuation near $12,000.
He argued that Ethereum is undervalued and gaining relative strength compared to Bitcoin (CRYPTO: BTC) this year.
ETH Struggles Under Trendline Pressure
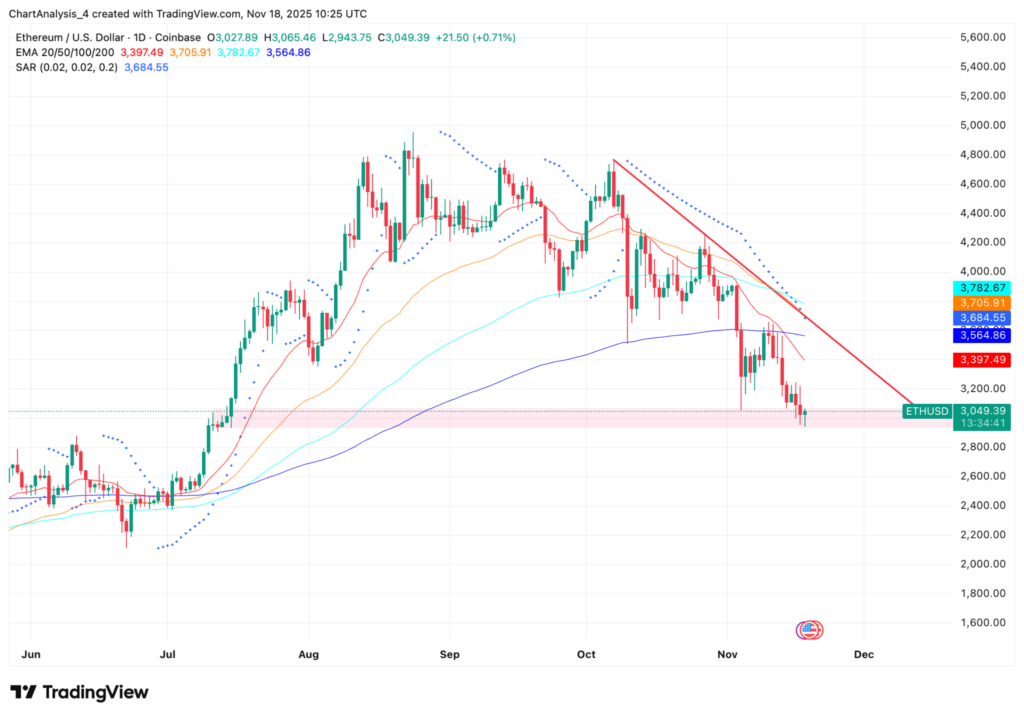
ETH Price Analysis (Source: TradingView)
Ethereum remains pinned below the descending trendline that has rejected every rally since mid-October.
Attempts to break into the $3,350 to $3,500 zone have failed, creating a sequence of lower highs that signals controlled selling.
The market continues to react to "trendline memory," and sellers have defended that level consistently.
The 20-day EMA sits near $3,397 and has capped every bounce.
The 50-day EMA at $3,705 and the 100-day EMA at $3,782 reinforce the medium-term bearish structure.
Even the 200-day EMA at $3,564 has started to flatten, showing that the broader trend is losing strength.
Also, the Parabolic SAR continues to print above price, and ETH has been sliding lower in a slow, controlled grind rather than a sharp breakdown.
Flows Still Show Heavy Distribution
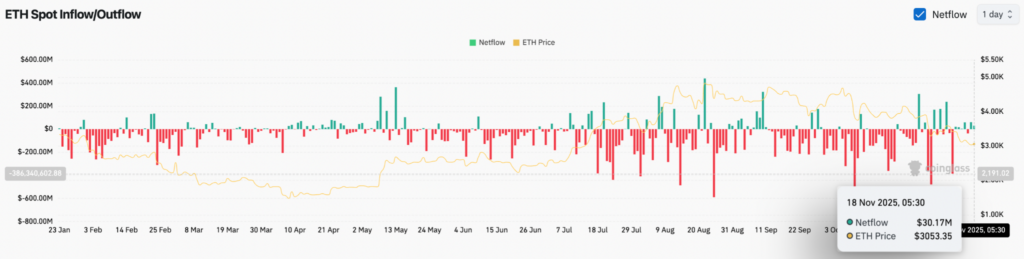
ETH Netflows (Source: Coinglass)
Spot exchange data from Coinglass shows that Ethereum has faced persistent outflows throughout the fall.
While the latest reading showed a modest $30.17 million inflow, the broader pattern remains negative.
Outflows signal that liquidity is leaving exchanges, and the lack of strong inflow surges has prevented a sustained rebound.
Buyers have attempted to defend the $3,000 zone, but order-flow imbalance continues to favor sellers.
Key Support Sits At $2,950 To $2,880
The most important short-term battleground is the $2,950 to $2,880 support band.
This level acted as a strong accumulation zone during the summer, but it is now being tested under weaker conditions.
A daily close below $2,880 would expose a slide toward $2,750, followed by $2,620, which aligns with July's consolidation range.
On the upside, ETH needs a clean break above the descending trendline and a daily close above $3,350.
Without that shift, every rally remains a counter-trend bounce rather than a reversal.
Read Next:
Image: Shutterstock
Posted In: $BTC $ETH