What to Expect from TJX Companies's Earnings
Author: Benzinga Insights | November 18, 2025 09:00am
TJX Companies (NYSE:TJX) will release its quarterly earnings report on Wednesday, 2025-11-19. Here's a brief overview for investors ahead of the announcement.
Analysts anticipate TJX Companies to report an earnings per share (EPS) of $1.22.
The announcement from TJX Companies is eagerly anticipated, with investors seeking news of surpassing estimates and favorable guidance for the next quarter.
It's worth noting for new investors that guidance can be a key determinant of stock price movements.
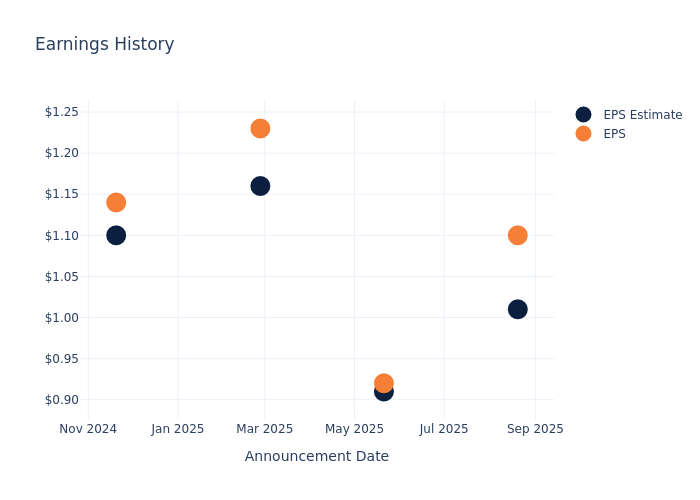
Past Earnings Performance
The company's EPS beat by $0.09 in the last quarter, leading to a 0.55% drop in the share price on the following day.
Here's a look at TJX Companies's past performance and the resulting price change:
| Quarter |
Q2 2026 |
Q1 2026 |
Q4 2025 |
Q3 2025 |
| EPS Estimate |
1.01 |
0.91 |
1.16 |
1.10 |
| EPS Actual |
1.10 |
0.92 |
1.23 |
1.14 |
| Price Change % |
-1.00 |
-1.00 |
-1.00 |
0.00 |
Performance of TJX Companies Shares
Shares of TJX Companies were trading at $145.18 as of November 17. Over the last 52-week period, shares are up 21.25%. Given that these returns are generally positive, long-term shareholders are likely bullish going into this earnings release.
Insights Shared by Analysts on TJX Companies
For investors, staying informed about market sentiments and expectations in the industry is paramount. This analysis provides an exploration of the latest insights on TJX Companies.
Analysts have provided TJX Companies with 17 ratings, resulting in a consensus rating of Outperform. The average one-year price target stands at $153.35, suggesting a potential 5.63% upside.
Analyzing Analyst Ratings Among Peers
The following analysis focuses on the analyst ratings and average 1-year price targets of Ross Stores, Burlington Stores and Gap, three prominent industry players, providing insights into their relative performance expectations and market positioning.
- Analysts currently favor an Outperform trajectory for Ross Stores, with an average 1-year price target of $163.0, suggesting a potential 12.27% upside.
- Analysts currently favor an Outperform trajectory for Burlington Stores, with an average 1-year price target of $343.07, suggesting a potential 136.31% upside.
- Analysts currently favor an Neutral trajectory for Gap, with an average 1-year price target of $25.65, suggesting a potential 82.33% downside.
Key Findings: Peer Analysis Summary
In the peer analysis summary, key metrics for Ross Stores, Burlington Stores and Gap are highlighted, providing an understanding of their respective standings within the industry and offering insights into their market positions and comparative performance.
| Company |
Consensus |
Revenue Growth |
Gross Profit |
Return on Equity |
| TJX Companies |
Outperform |
6.93% |
$4.42B |
14.31% |
| Ross Stores |
Outperform |
4.57% |
$1.53B |
8.98% |
| Burlington Stores |
Outperform |
9.72% |
$1.19B |
6.73% |
| Gap |
Neutral |
0.13% |
$1.54B |
6.40% |
Key Takeaway:
TJX Companies ranks highest in revenue growth among its peers. It also leads in gross profit margin. However, its return on equity is lower compared to one peer. Overall, TJX Companies is positioned favorably compared to its peers in this analysis.
Unveiling the Story Behind TJX Companies
TJX Companies is the leading off-price retailer of apparel, accessories, and home merchandise in the United States. The firm leverages its more than 21,000 global vendor relationships to procure and sell branded merchandise at prices 20%-60% cheaper than conventional retail channels. TJX opportunistically purchases excess inventory that stems from manufacturing overruns and retail closeout sales. The retailer disperses its vast and disparate merchandise across its 5,100 global stores, creating a treasure-hunt shopping experience for consumers. Over three quarters of TJX's sales are derived from the United States, primarily via the T.J. Maxx, Marshalls, and HomeGoods banners. About 10% of sales come from Canada and 12% from Europe and Australia.
Breaking Down TJX Companies's Financial Performance
Market Capitalization: Exceeding industry standards, the company's market capitalization places it above industry average in size relative to peers. This emphasizes its significant scale and robust market position.
Revenue Growth: Over the 3 months period, TJX Companies showcased positive performance, achieving a revenue growth rate of 6.93% as of 31 July, 2025. This reflects a substantial increase in the company's top-line earnings. As compared to competitors, the company surpassed expectations with a growth rate higher than the average among peers in the Consumer Discretionary sector.
Net Margin: TJX Companies's net margin is impressive, surpassing industry averages. With a net margin of 8.63%, the company demonstrates strong profitability and effective cost management.
Return on Equity (ROE): TJX Companies's ROE stands out, surpassing industry averages. With an impressive ROE of 14.31%, the company demonstrates effective use of equity capital and strong financial performance.
Return on Assets (ROA): TJX Companies's financial strength is reflected in its exceptional ROA, which exceeds industry averages. With a remarkable ROA of 3.84%, the company showcases efficient use of assets and strong financial health.
Debt Management: The company maintains a balanced debt approach with a debt-to-equity ratio below industry norms, standing at 1.48.
To track all earnings releases for TJX Companies visit their earnings calendar on our site.
This article was generated by Benzinga's automated content engine and reviewed by an editor.
Posted In: TJX