A Peek at NVIDIA's Future Earnings
Author: Benzinga Insights | November 18, 2025 09:01am
NVIDIA (NASDAQ:NVDA) is set to give its latest quarterly earnings report on Wednesday, 2025-11-19. Here's what investors need to know before the announcement.
Analysts estimate that NVIDIA will report an earnings per share (EPS) of $1.22.
The announcement from NVIDIA is eagerly anticipated, with investors seeking news of surpassing estimates and favorable guidance for the next quarter.
It's worth noting for new investors that guidance can be a key determinant of stock price movements.
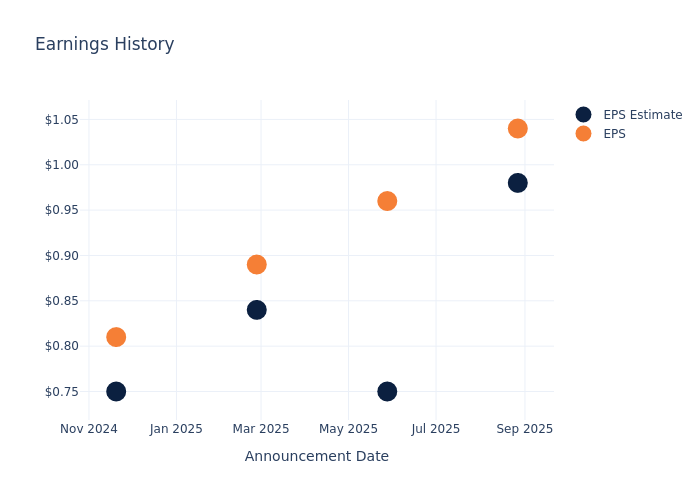
Overview of Past Earnings
In the previous earnings release, the company beat EPS by $0.06, leading to a 0.79% drop in the share price the following trading session.
Here's a look at NVIDIA's past performance and the resulting price change:
| Quarter |
Q2 2026 |
Q1 2026 |
Q4 2025 |
Q3 2025 |
| EPS Estimate |
0.98 |
0.75 |
0.84 |
0.75 |
| EPS Actual |
1.04 |
0.96 |
0.89 |
0.81 |
| Price Change % |
-1.00 |
3.00 |
-8.00 |
1.00 |
Tracking NVIDIA's Stock Performance
Shares of NVIDIA were trading at $186.6 as of November 17. Over the last 52-week period, shares are up 27.9%. Given that these returns are generally positive, long-term shareholders should be satisfied going into this earnings release.
Insights Shared by Analysts on NVIDIA
For investors, staying informed about market sentiments and expectations in the industry is paramount. This analysis provides an exploration of the latest insights on NVIDIA.
With 50 analyst ratings, NVIDIA has a consensus rating of Buy. The average one-year price target is $233.08, indicating a potential 24.91% upside.
Peer Ratings Comparison
The following analysis focuses on the analyst ratings and average 1-year price targets of Broadcom, Advanced Micro Devices and Micron Technology, three prominent industry players, providing insights into their relative performance expectations and market positioning.
- Analysts currently favor an Outperform trajectory for Broadcom, with an average 1-year price target of $382.9, suggesting a potential 105.2% upside.
- Analysts currently favor an Buy trajectory for Advanced Micro Devices, with an average 1-year price target of $276.57, suggesting a potential 48.22% upside.
- Analysts currently favor an Outperform trajectory for Micron Technology, with an average 1-year price target of $210.91, suggesting a potential 13.03% upside.
Key Findings: Peer Analysis Summary
In the peer analysis summary, key metrics for Broadcom, Advanced Micro Devices and Micron Technology are highlighted, providing an understanding of their respective standings within the industry and offering insights into their market positions and comparative performance.
| Company |
Consensus |
Revenue Growth |
Gross Profit |
Return on Equity |
| NVIDIA |
Buy |
55.60% |
$33.85B |
28.72% |
| Broadcom |
Outperform |
22.03% |
$10.70B |
5.80% |
| Advanced Micro Devices |
Buy |
35.59% |
$4.78B |
2.06% |
| Micron Technology |
Outperform |
46.00% |
$5.05B |
6.10% |
Key Takeaway:
NVIDIA ranks highest in Revenue Growth among its peers. It also leads in Gross Profit margin. However, it has the lowest Return on Equity. Overall, NVIDIA is positioned at the top compared to its peers in terms of financial performance metrics.
Delving into NVIDIA's Background
Nvidia is a leading developer of graphics processing units. Traditionally, GPUs were used to enhance the experience on computing platforms, most notably in gaming applications on PCs. GPU use cases have since emerged as important semiconductors used in artificial intelligence to run large language models. Nvidia not only offers AI GPUs, but also a software platform, Cuda, used for AI model development and training. Nvidia is also expanding its data center networking solutions, helping to tie GPUs together to handle complex workloads.
NVIDIA's Financial Performance
Market Capitalization Analysis: With a profound presence, the company's market capitalization is above industry averages. This reflects substantial size and strong market recognition.
Positive Revenue Trend: Examining NVIDIA's financials over 3 months reveals a positive narrative. The company achieved a noteworthy revenue growth rate of 55.6% as of 31 July, 2025, showcasing a substantial increase in top-line earnings. As compared to its peers, the company achieved a growth rate higher than the average among peers in Information Technology sector.
Net Margin: The company's net margin is a standout performer, exceeding industry averages. With an impressive net margin of 56.53%, the company showcases strong profitability and effective cost control.
Return on Equity (ROE): The company's ROE is a standout performer, exceeding industry averages. With an impressive ROE of 28.72%, the company showcases effective utilization of equity capital.
Return on Assets (ROA): NVIDIA's ROA surpasses industry standards, highlighting the company's exceptional financial performance. With an impressive 19.87% ROA, the company effectively utilizes its assets for optimal returns.
Debt Management: The company maintains a balanced debt approach with a debt-to-equity ratio below industry norms, standing at 0.11.
To track all earnings releases for NVIDIA visit their earnings calendar on our site.
This article was generated by Benzinga's automated content engine and reviewed by an editor.
Posted In: NVDA