Uncovering Potential: Global E Online's Earnings Preview
Author: Benzinga Insights | November 18, 2025 09:02am
Global E Online (NASDAQ:GLBE) is set to give its latest quarterly earnings report on Wednesday, 2025-11-19. Here's what investors need to know before the announcement.
Analysts estimate that Global E Online will report an earnings per share (EPS) of $0.15.
Investors in Global E Online are eagerly awaiting the company's announcement, hoping for news of surpassing estimates and positive guidance for the next quarter.
It's worth noting for new investors that stock prices can be heavily influenced by future projections rather than just past performance.
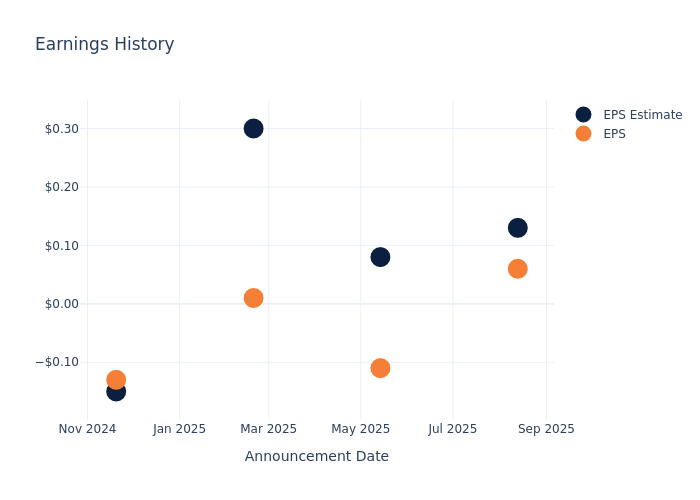
Earnings History Snapshot
The company's EPS missed by $0.07 in the last quarter, leading to a 1.48% drop in the share price on the following day.
Here's a look at Global E Online's past performance and the resulting price change:
| Quarter |
Q2 2025 |
Q1 2025 |
Q4 2024 |
Q3 2024 |
| EPS Estimate |
0.13 |
0.08 |
0.30 |
-0.15 |
| EPS Actual |
0.06 |
-0.11 |
0.01 |
-0.13 |
| Price Change % |
-1.00 |
-3.00 |
-8.00 |
4.00 |
Global E Online Share Price Analysis
Shares of Global E Online were trading at $35.13 as of November 17. Over the last 52-week period, shares are down 26.6%. Given that these returns are generally negative, long-term shareholders are likely bearish going into this earnings release.
Analyst Insights on Global E Online
For investors, staying informed about market sentiments and expectations in the industry is paramount. This analysis provides an exploration of the latest insights on Global E Online.
Analysts have given Global E Online a total of 1 ratings, with the consensus rating being Buy. The average one-year price target is $44.0, indicating a potential 25.25% upside.
Peer Ratings Comparison
This comparison focuses on the analyst ratings and average 1-year price targets of Macy's, Ollie's Bargain Outlet and Pattern Group, three major players in the industry, shedding light on their relative performance expectations and market positioning.
- Analysts currently favor an Neutral trajectory for Macy's, with an average 1-year price target of $14.8, suggesting a potential 57.87% downside.
- Analysts currently favor an Neutral trajectory for Ollie's Bargain Outlet, with an average 1-year price target of $143.67, suggesting a potential 308.97% upside.
- Analysts currently favor an Outperform trajectory for Pattern Group, with an average 1-year price target of $19.29, suggesting a potential 45.09% downside.
Snapshot: Peer Analysis
In the peer analysis summary, key metrics for Macy's, Ollie's Bargain Outlet and Pattern Group are highlighted, providing an understanding of their respective standings within the industry and offering insights into their market positions and comparative performance.
| Company |
Consensus |
Revenue Growth |
Gross Profit |
Return on Equity |
| Global E Online |
Buy |
27.90% |
$97.67M |
1.17% |
| Macy's |
Neutral |
-1.90% |
$2.10B |
1.95% |
| Ollie's Bargain Outlet |
Neutral |
17.49% |
$271.34M |
3.49% |
| Pattern Group |
Outperform |
45.58% |
$283.52M |
-64.04% |
Key Takeaway:
Global E Online ranks first in revenue growth among its peers. It has the lowest gross profit and return on equity compared to its peers.
Unveiling the Story Behind Global E Online
Global E Online Ltd provides e-commerce solutions. The company offers a platform to enable and accelerate direct-to-consumer cross-border e-commerce. The platform was purpose-built for international shoppers to buy seamlessly online and for merchants to sell from and anywhere in the world. The company localizes the shopper experience to make international transactions as seamless as domestic ones. The platform increases the conversion of international traffic into sales by removing much of the complexity associated with international e-commerce. The company derives maximum revenue from the United States.
Understanding the Numbers: Global E Online's Finances
Market Capitalization Analysis: Below industry benchmarks, the company's market capitalization reflects a smaller scale relative to peers. This could be attributed to factors such as growth expectations or operational capacity.
Revenue Growth: Global E Online's revenue growth over a period of 3 months has been noteworthy. As of 30 June, 2025, the company achieved a revenue growth rate of approximately 27.9%. This indicates a substantial increase in the company's top-line earnings. As compared to competitors, the company surpassed expectations with a growth rate higher than the average among peers in the Consumer Discretionary sector.
Net Margin: Global E Online's net margin surpasses industry standards, highlighting the company's exceptional financial performance. With an impressive 4.88% net margin, the company effectively manages costs and achieves strong profitability.
Return on Equity (ROE): Global E Online's ROE stands out, surpassing industry averages. With an impressive ROE of 1.17%, the company demonstrates effective use of equity capital and strong financial performance.
Return on Assets (ROA): Global E Online's ROA stands out, surpassing industry averages. With an impressive ROA of 0.88%, the company demonstrates effective utilization of assets and strong financial performance.
Debt Management: Global E Online's debt-to-equity ratio is below the industry average at 0.03, reflecting a lower dependency on debt financing and a more conservative financial approach.
To track all earnings releases for Global E Online visit their earnings calendar on our site.
This article was generated by Benzinga's automated content engine and reviewed by an editor.
Posted In: GLBE