Has my stock been accused of fraud?Join over 160k users who know.

Ticker Price Change($) Change(%) Shares Volume Prev Close Open Gain($) Gain(%)
Ticker Status Jurisdiction Filing Date CP Start CP End CP Loss Deadline
Ticker Case Name Status CP Start CP End Deadline Settlement Amt
Ticker Name Date Analyst Firm Up/Down Target ($) Rating Change Rating Current

News

XRP Holds For Now, But Data Shows A Brutal Drop To $1.65 May Come Soon

Author: Parshwa Turakhiya | November 18, 2025 10:00am

XRP (CRYPTO: XRP) is flat on Tuesday morning, but data shows that any upside price action may just be a temporary relief bounce.

Bearish Retest Forms As XRP Rejects Broken Pattern

XRP Price Dynamics (Source: TradingView)

XRP's small uptick is occurring directly beneath a heavy resistance cluster, with price tagging the underside of the broken symmetrical wedge.

The token slipped below the lower boundary last week, and today's green candle is touching that same trendline from below.

Traders view this as a standard bearish retest.

Sellers remain active as long as XRP trades under the EMA band between $2.33 and $2.48.

The 20-day and 50-day averages converge in this zone, forming the next structural test for buyers attempting to regain momentum.

$50M Outflows Reinforce Downside Pressure

XRP Netflows (Source: Coinglass)

Spot flow data recorded another $50.6 million net outflow on Nov. 18, extending a multi-month series of heavy red prints.

The market has not seen a sustained period of positive inflow since July.

Persistent distribution suggests large holders continue reducing exposure into every counter-trend bounce.

Flow-driven selling remains one of the key reasons XRP has failed to establish any durable recovery this quarter.

Weekly Chart Targets Lower Fib Levels

XRP Weekly Price Action (Source: TradingView)

XRP trades below the 0.382 Fibonacci level at $2.47, with multiple failed attempts to reclaim the mid-range.

A rejection near $2.92 earlier this quarter confirmed a lower high in the broader cycle.

MACD remains negative with expanding downside histograms, while RSI trends near 41 without any bullish divergence.

Momentum indicators show sellers still firmly in control across higher-timeframe views.

Liquidity Zones Point Toward $1.65

The descending channel drawn from the yearly high continues guiding price lower.

Immediate liquidity pockets sit at $2.05 and $1.85.

Today's 1% rise is not a shift in trend.

It is a tag of a broken pattern, a setup that often precedes continuation moves lower.

XRP must reclaim the EMA cluster and close decisively above $2.48 to improve structure.

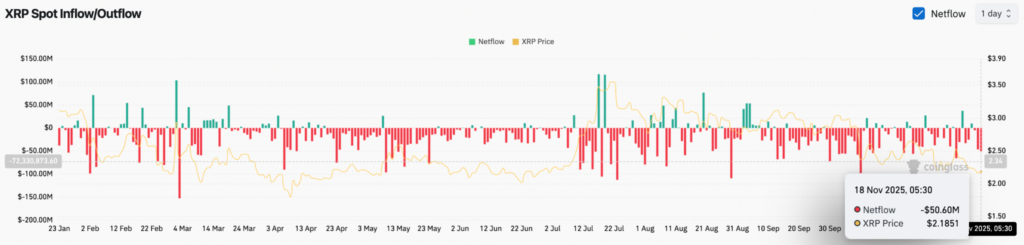
Until that occurs, the path of least resistance continues downward, and flow-based selling raises the risk of a slide into the $1.60–$1.70 region.

Broader market sentiment remains cautious as Bitcoin (CRYPTO: BTC) trades near $91,100 after breaking its cycle trendline and Ethereum (CRYPTO: ETH) holds around $3,030 while defending a multi-month support shelf.

Read Next:

Image: Shutterstock

Posted In: $BTC $ETH $XRP

CLASS ACTION DEADLINES - JOIN NOW!

NEW CASE INVESTIGATION

CORE Finalist