Has my stock been accused of fraud?Join over 160k users who know.

Ticker Price Change($) Change(%) Shares Volume Prev Close Open Gain($) Gain(%)
Ticker Status Jurisdiction Filing Date CP Start CP End CP Loss Deadline
Ticker Case Name Status CP Start CP End Deadline Settlement Amt
Ticker Name Date Analyst Firm Up/Down Target ($) Rating Change Rating Current

News

Bitcoin Crashes To 'Extreme Fear' — But History Shows That's Not A Buy Signal

Author: Parshwa Turakhiya | November 18, 2025 12:57pm

Bitcoin's (CRYPTO: BTC) Fear Index has plunged to 12, but historical sentiment patterns suggest this level rarely marks a true bottom.

Extreme Fear Deepens As Sentiment Hits One Of Its Lowest Readings

Crypto Fear & Greed Index (Source: Coinglass)

Social and derivatives data show traders calling for a bottom, but historical behavior suggests fear phases tend to linger rather than reverse quickly.

That history highlights how long sentiment can remain depressed even without a sharp breakdown or recovery.

Across every period when the index fell below 10, Bitcoin's median 30-day return was only 2.1%, with wide variations.

Roughly 63% of those periods ended positive, but gains were modest and inconsistent, often followed by extended sideways trading.

Heavy Outflows Point Toward Defensive Positioning

BTC Netflows (Source: Coinglass)

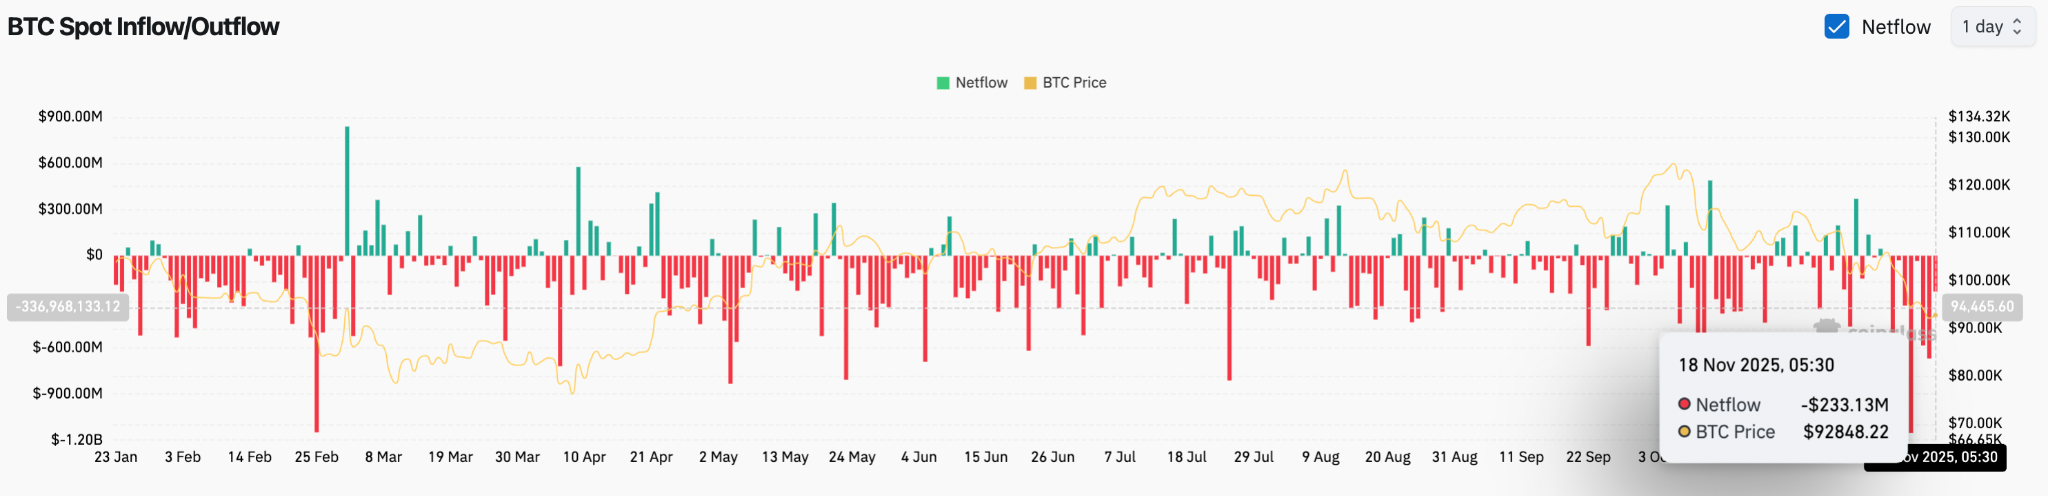
Spot exchanges have recorded more than $3.6 billion in outflows since Nov. 10, according to Coinglass, signaling persistent risk-off positioning.

Another $233 million left exchanges on Nov. 18, following a $901 million withdrawal the day before.

Large outflow clusters of this size typically reflect capitulation rather than accumulation.

The pattern aligns with the sharp drop in sentiment and indicates that traders continue reducing exposure as price struggles to regain the $95,000–$100,000 zone.

Trendline Break Confirms Structural Weakness

BTC Key Technical Levels (Source: TradingView)

Bitcoin is now trading below the year-long trendline that supported every major rebound through the 2024–2025 cycle.

The structural break follows the loss of the $100,000 floor, which had served as a key psychological anchor throughout the year.

All major EMAs sit overhead, with the 20- and 50-day band between $100,900 and $107,100 now forming a strong resistance cluster.

The alignment reflects a clear bearish shift, where every rally into the EMA zone has been sold.

The Supertrend remains red, confirming continued downside bias.

If momentum stays weak, Bitcoin risks extending lower toward $88,000.

A deeper slide toward $82,000 is possible, where the next major liquidity pocket appears on the visible range profile.

Read Next:

Image: Shutterstock

Posted In: $BTC

CLASS ACTION DEADLINES - JOIN NOW!

NEW CASE INVESTIGATION

CORE Finalist