Can Bitcoin Crash To $10,000? Yes, If It Follows This 2018 Pattern, Expert Says
Author: Parshwa Turakhiya | November 19, 2025 07:54am
Bitcoin (CRYPTO: BTC) is back under pressure as Bloomberg's Mike McGlone warns the market could unwind all the way to $10,000.
McGlone Draws 2018 Comparison
McGlone said during a segment on Bloomberg TV on Tuesday that Bitcoin's current structure resembles the major unwinds seen in 2018, when price collapsed from $10,000 to nearly $3,000.
He said he believes the market could return to $10,000 if pressure continues across risk assets.
He argued that expanding token supply, late-cycle ETF inflows and a weaker macro backdrop leave the market vulnerable to a similar breakdown.
He pointed to volatility signals such as the VIX sitting near its 200-day average and noted that realized volatility in the S&P 500(NYSE:SPY) has slipped to levels last seen in 2017.
McGlone warned that rising turbulence across risk assets could spill into equities and said he does not see any clear catalyst that would halt Bitcoin's downside momentum.
Key Levels Shift As Downtrend Deepens
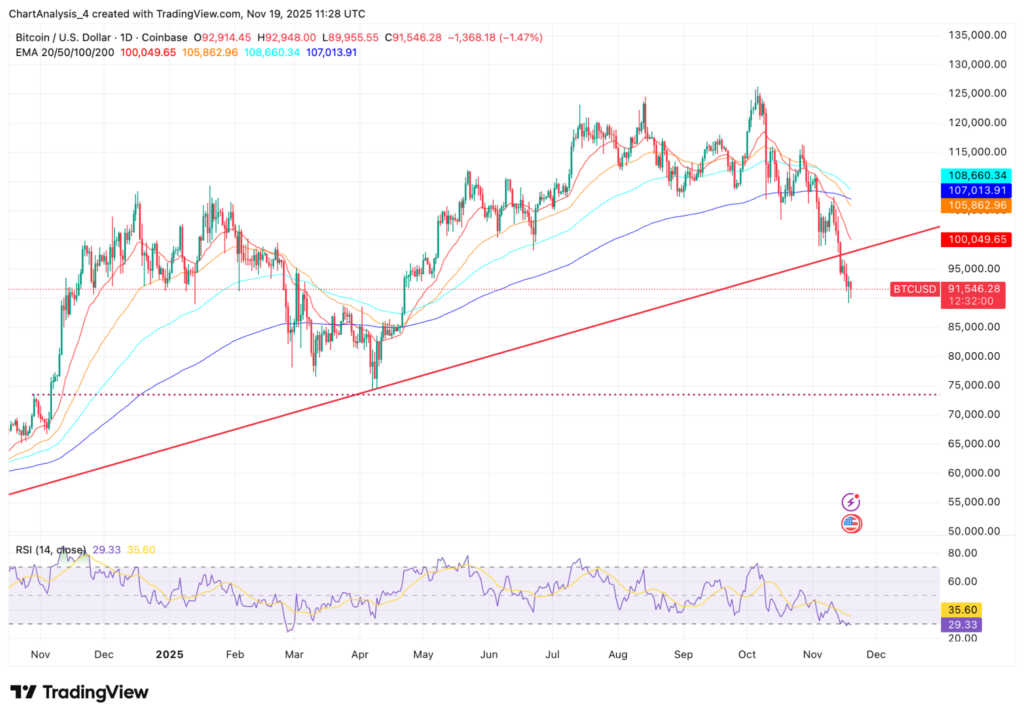
McGlone identified $100,000 as the new resistance zone after Bitcoin lost that level earlier in the month.
He said the market is now trapped between $90,000 and $100,000, with a possible breakdown toward $50,000 if conditions deteriorate.
He cited the rollover in Bitcoin's 200-day moving average as a key indicator.
He also said Strategy's(NASDAQ:MSTR) 200-day average showed a similar shift in August, reinforcing the broader trend.
Bloomberg Galaxy Crypto Index is down 14% this year after an early rebound, he added.