BlackRock's Bitcoin ETF Sheds Record $520 Million: What's Up With IBIT?
Author: Parshwa Turakhiya | November 19, 2025 09:00am
A record $520 million exited BlackRock's iShares Bitcoin Trust(NASDAQ:IBIT) on Wednesday, signaling institutional confidence has flipped sharply defensive.
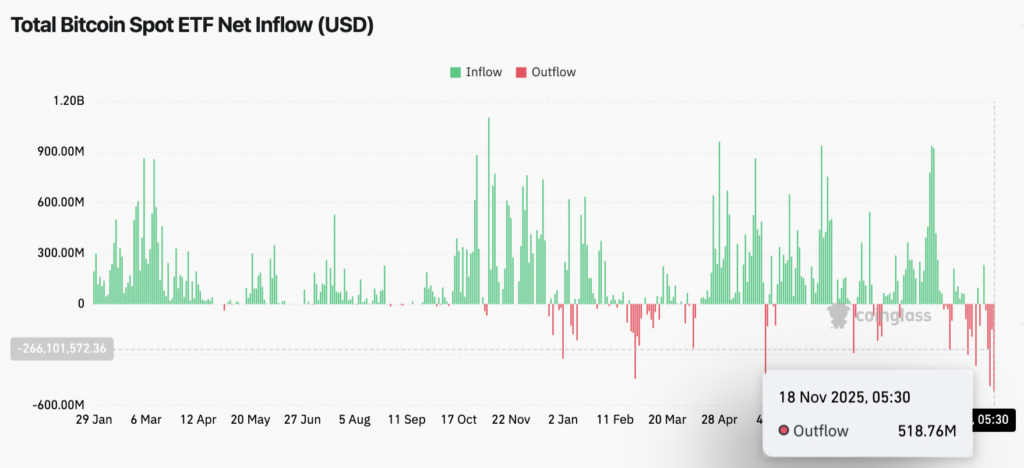
Spot Bitcoin(CRYPTO: BTC) ETF flows have deteriorated sharply in November, according to Coinglass.
Redemptions have been accelerating throughout the month and culminated in roughly $520 million leaving IBIT on Nov. 18, its largest single-day outflow on record.
Earlier this year, large inflows supported every breakout attempt.
That relationship has reversed. ETF holders are now using redemptions to reduce exposure during weakness instead of buying dips.
The shift has created a structural headwind for price as demand from funds no longer offsets selling pressure.
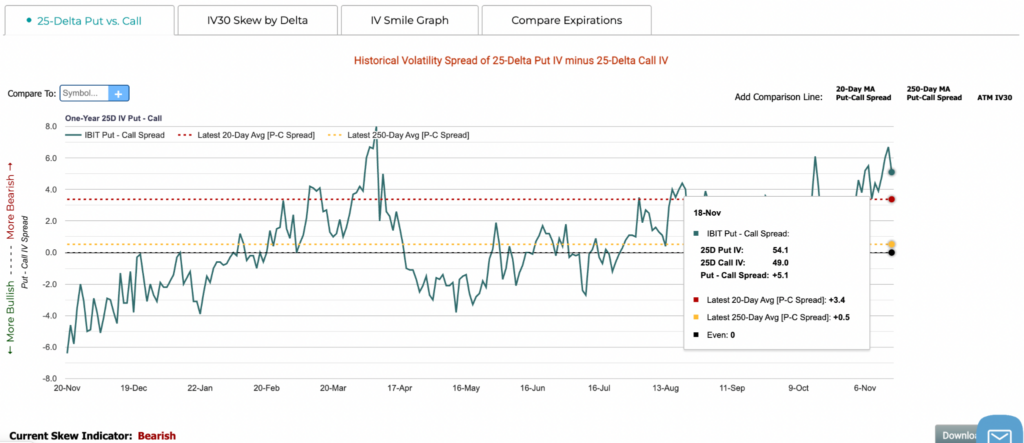
One-year history of the 25-delta put minus call implied volatility spread shows the curve pushing toward the upper end of its range.
On November 18, 25-delta put IV was near 54 while call IV was around 49, leaving a positive skew of about +5 volatility points.
That is well above the longer-term average near neutral and higher than the 20-day average near +3.4.
The skew gauge is marked bearish, indicating traders are paying a premium for downside protection.
The rise in skew developed alongside the record outflows rather than preceding them, which suggests investors are reacting to stress rather than preparing for a quick rebound.
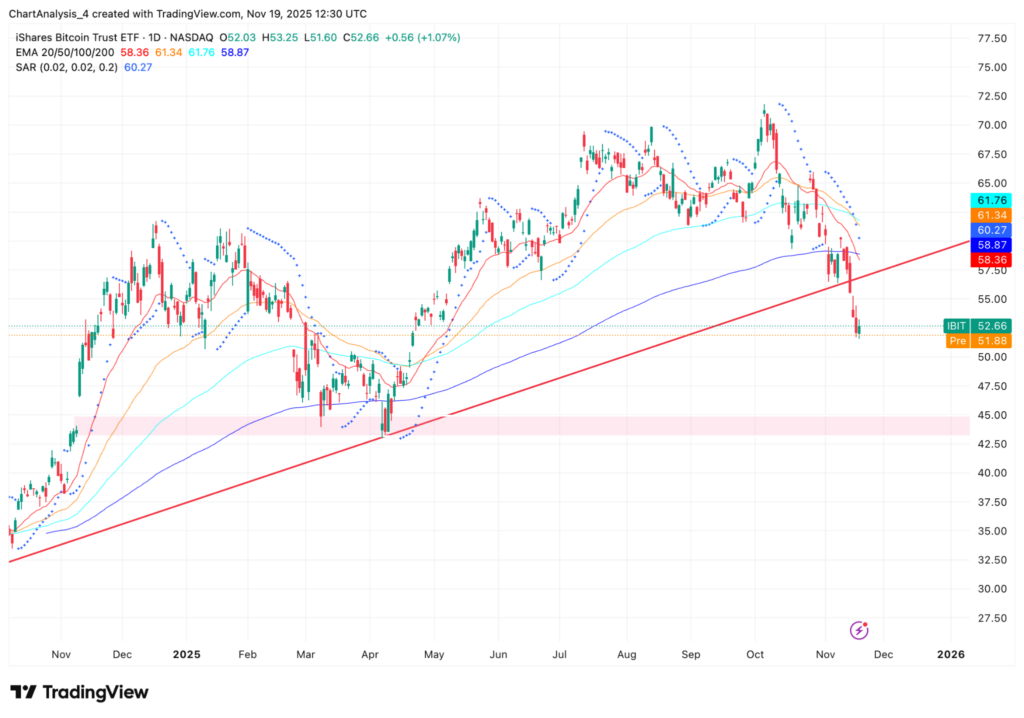
IBIT sliced through the long-term trendline that anchored its advance since late 2024, triggering a shift from a steady uptrend into a corrective phase.
Price now sits well below the 20, 50, 100 and 200-day EMAs, all of which have rolled over and formed layered resistance in the high $50s to low $60s.
The breakdown arrived with a wide red candle and only a shallow intraday bounce.
Additional weakness followed, dragging IBIT toward the low $50s and confirming firm control by sellers.
The Parabolic SAR has flipped above price and continues to decline, reflecting persistent downside momentum.
Immediate resistance is the broken trendline and the 200-day EMA.
On the downside, the next reference levels are the psychological $50 mark and the prior demand zone between $44 and $46.
Why It Matters
The record $520 million exit from IBIT lands at the exact moment Bitcoin snaps its year-long ascending trendline, a pairing that almost never happens without deeper structural consequences.
The BTC chart shows price sliding beneath a support line that held every major rebound since 2024, meaning ETF outflows are now reinforcing a break that historically only appears in early bear-market phases.
Large funds are no longer cushioning declines; rather, they are accelerating them — and that marks a decisive shift in how institutional capital reacts to stress.
If the trendline break holds, Bitcoin's liquidity profile changes, risk models tighten, and ETF flows lose their role as the cycle's stabilizer.
For investors, this is the first time since launch that IBIT redemptions and BTC technicals are pointing in the same direction, and that direction is down.