Performance Comparison: Microsoft And Competitors In Software Industry
Author: Benzinga Insights | November 19, 2025 10:00am
Amidst the fast-paced and highly competitive business environment of today, conducting comprehensive company analysis is essential for investors and industry enthusiasts. In this article, we will delve into an extensive industry comparison, evaluating Microsoft (NASDAQ:MSFT) in comparison to its major competitors within the Software industry. By analyzing critical financial metrics, market position, and growth potential, our objective is to provide valuable insights for investors and offer a deeper understanding of company's performance in the industry.
Microsoft Background
Microsoft develops and licenses consumer and enterprise software. It is known for its Windows operating systems and Office productivity suite. The company is organized into three equally sized broad segments: productivity and business processes (legacy Microsoft Office, cloud-based Office 365, Exchange, SharePoint, Skype, LinkedIn, Dynamics), intelligence cloud (infrastructure- and platform-as-a-service offerings Azure, Windows Server OS, SQL Server), and more personal computing (Windows Client, Xbox, Bing search, display advertising, and Surface laptops, tablets, and desktops).
| Company |
P/E |
P/B |
P/S |
ROE |
EBITDA (in billions) |
Gross Profit (in billions) |
Revenue Growth |
| Microsoft Corp |
35.12 |
10.11 |
12.54 |
7.85% |
$48.06 |
$53.63 |
18.43% |
| Oracle Corp |
51.04 |
26.02 |
10.76 |
13.12% |
$6.12 |
$10.04 |
12.17% |
| ServiceNow Inc |
98.91 |
15.02 |
13.53 |
4.52% |
$0.89 |
$2.63 |
21.81% |
| Palo Alto Networks Inc |
125.62 |
17.57 |
15.46 |
3.37% |
$0.68 |
$1.86 |
15.84% |
| Fortinet Inc |
32.98 |
81.08 |
9.43 |
33.9% |
$0.64 |
$1.39 |
14.38% |
| Gen Digital Inc |
28.96 |
6.61 |
3.68 |
5.56% |
$0.5 |
$0.95 |
25.26% |
| Monday.Com Ltd |
124.53 |
6.23 |
6.98 |
1.06% |
$0.0 |
$0.28 |
26.24% |
| UiPath Inc |
458 |
4.38 |
5.02 |
0.09% |
$-0.02 |
$0.3 |
14.38% |
| Dolby Laboratories Inc |
23.97 |
2.39 |
4.70 |
1.78% |
$0.07 |
$0.27 |
9.25% |
| CommVault Systems Inc |
69.62 |
25.67 |
5.06 |
5.12% |
$0.02 |
$0.22 |
18.39% |
| Qualys Inc |
26.84 |
9.38 |
7.78 |
9.7% |
$0.06 |
$0.14 |
10.41% |
| Teradata Corp |
22.14 |
11.40 |
1.57 |
20.25% |
$0.09 |
$0.25 |
-5.45% |
| Average |
96.6 |
18.7 |
7.63 |
8.95% |
$0.82 |
$1.67 |
14.79% |
By conducting a comprehensive analysis of Microsoft, the following trends become evident:
-
The stock's Price to Earnings ratio of 35.12 is lower than the industry average by 0.36x, suggesting potential value in the eyes of market participants.
-
Considering a Price to Book ratio of 10.11, which is well below the industry average by 0.54x, the stock may be undervalued based on its book value compared to its peers.
-
With a relatively high Price to Sales ratio of 12.54, which is 1.64x the industry average, the stock might be considered overvalued based on sales performance.
-
The company has a lower Return on Equity (ROE) of 7.85%, which is 1.1% below the industry average. This indicates potential inefficiency in utilizing equity to generate profits, which could be attributed to various factors.
-
With higher Earnings Before Interest, Taxes, Depreciation, and Amortization (EBITDA) of $48.06 Billion, which is 58.61x above the industry average, the company demonstrates stronger profitability and robust cash flow generation.
-
Compared to its industry, the company has higher gross profit of $53.63 Billion, which indicates 32.11x above the industry average, indicating stronger profitability and higher earnings from its core operations.
-
The company's revenue growth of 18.43% exceeds the industry average of 14.79%, indicating strong sales performance and market outperformance.
Debt To Equity Ratio
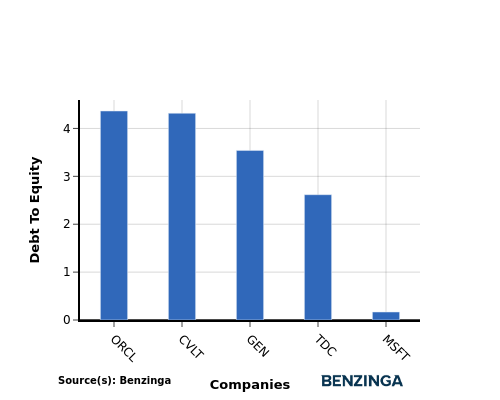
The debt-to-equity (D/E) ratio helps evaluate the capital structure and financial leverage of a company.
Considering the debt-to-equity ratio in industry comparisons allows for a concise evaluation of a company's financial health and risk profile, aiding in informed decision-making.
When evaluating Microsoft alongside its top 4 peers in terms of the Debt-to-Equity ratio, the following insights arise:
-
Microsoft exhibits a stronger financial position compared to its top 4 peers in the sector, as indicated by its lower debt-to-equity ratio of 0.17.
-
This suggests that the company has a more favorable balance between debt and equity, which can be seen as a positive aspect for investors.
Key Takeaways
For Microsoft in the Software industry, the PE and PB ratios suggest that the company is undervalued compared to its peers. However, the high PS ratio indicates that the market values Microsoft's sales more highly. In terms of ROE, EBITDA, gross profit, and revenue growth, Microsoft demonstrates strong performance relative to its industry competitors, reflecting efficient operations and healthy growth prospects.
This article was generated by Benzinga's automated content engine and reviewed by an editor.
Posted In: MSFT