Earnings Preview: Elastic
Author: Benzinga Insights | November 19, 2025 10:02am
Elastic (NYSE:ESTC) is preparing to release its quarterly earnings on Thursday, 2025-11-20. Here's a brief overview of what investors should keep in mind before the announcement.
Analysts expect Elastic to report an earnings per share (EPS) of $0.33.
Anticipation surrounds Elastic's announcement, with investors hoping to hear about both surpassing estimates and receiving positive guidance for the next quarter.
New investors should understand that while earnings performance is important, market reactions are often driven by guidance.
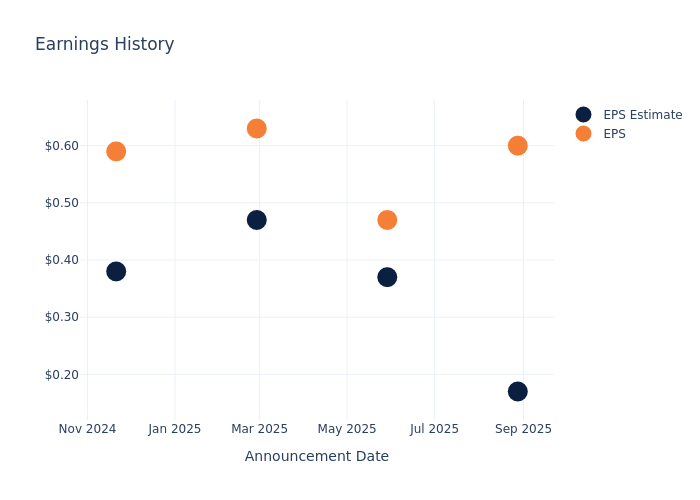
Past Earnings Performance
During the last quarter, the company reported an EPS beat by $0.43, leading to a 3.11% drop in the share price on the subsequent day.
Here's a look at Elastic's past performance and the resulting price change:
| Quarter |
Q1 2026 |
Q4 2025 |
Q3 2025 |
Q2 2025 |
| EPS Estimate |
0.17 |
0.37 |
0.47 |
0.38 |
| EPS Actual |
0.60 |
0.47 |
0.63 |
0.59 |
| Price Change % |
-3.00 |
-12.00 |
15.00 |
15.00 |
Stock Performance
Shares of Elastic were trading at $88.56 as of November 18. Over the last 52-week period, shares are down 6.25%. Given that these returns are generally negative, long-term shareholders are likely bearish going into this earnings release.
Analyst Insights on Elastic
For investors, grasping market sentiments and expectations in the industry is vital. This analysis explores the latest insights regarding Elastic.
Analysts have given Elastic a total of 18 ratings, with the consensus rating being Buy. The average one-year price target is $119.72, indicating a potential 35.19% upside.
Understanding Analyst Ratings Among Peers
In this comparison, we explore the analyst ratings and average 1-year price targets of Pegasystems, InterDigital and Manhattan Associates, three prominent industry players, offering insights into their relative performance expectations and market positioning.
- Analysts currently favor an Buy trajectory for Pegasystems, with an average 1-year price target of $73.4, suggesting a potential 17.12% downside.
- Analysts currently favor an Buy trajectory for InterDigital, with an average 1-year price target of $425.0, suggesting a potential 379.9% upside.
- Analysts currently favor an Outperform trajectory for Manhattan Associates, with an average 1-year price target of $231.88, suggesting a potential 161.83% upside.
Overview of Peer Analysis
In the peer analysis summary, key metrics for Pegasystems, InterDigital and Manhattan Associates are highlighted, providing an understanding of their respective standings within the industry and offering insights into their market positions and comparative performance.
| Company |
Consensus |
Revenue Growth |
Gross Profit |
Return on Equity |
| Elastic |
Buy |
19.53% |
$318.54M |
-2.59% |
| Pegasystems |
Buy |
17.32% |
$275.46M |
7.10% |
| InterDigital |
Buy |
27.98% |
$144.97M |
6.17% |
| Manhattan Associates |
Outperform |
3.42% |
$155.98M |
19.94% |
Key Takeaway:
Elastic ranks first in revenue growth among its peers. It ranks last in gross profit margin. It has the lowest return on equity.
Unveiling the Story Behind Elastic
Elastic is a software company that specializes in AI-search, observability, and security deployments. Its search division offers both traditional keyword search and vector search methods to enable more context-aware querying. The software has open-source origins but generates revenue through valuable add-ons, including simplified data orchestration and server scaling techniques.
Key Indicators: Elastic's Financial Health
Market Capitalization: Indicating a reduced size compared to industry averages, the company's market capitalization poses unique challenges.
Revenue Growth: Over the 3 months period, Elastic showcased positive performance, achieving a revenue growth rate of 19.53% as of 31 July, 2025. This reflects a substantial increase in the company's top-line earnings. As compared to competitors, the company encountered difficulties, with a growth rate lower than the average among peers in the Information Technology sector.
Net Margin: Elastic's net margin is impressive, surpassing industry averages. With a net margin of -5.92%, the company demonstrates strong profitability and effective cost management.
Return on Equity (ROE): Elastic's ROE is below industry standards, pointing towards difficulties in efficiently utilizing equity capital. With an ROE of -2.59%, the company may encounter challenges in delivering satisfactory returns for shareholders.
Return on Assets (ROA): Elastic's financial strength is reflected in its exceptional ROA, which exceeds industry averages. With a remarkable ROA of -0.96%, the company showcases efficient use of assets and strong financial health.
Debt Management: Elastic's debt-to-equity ratio surpasses industry norms, standing at 0.61. This suggests the company carries a substantial amount of debt, posing potential financial challenges.
To track all earnings releases for Elastic visit their earnings calendar on our site.
This article was generated by Benzinga's automated content engine and reviewed by an editor.
Posted In: ESTC