Analyst Flags Oversold Signals Across Key Timeframes
Bitcoin's decline has pushed the daily RSI into oversold conditions, with the analyst noting that similar readings marked primary lows at $83,000 and again during the July and October resets.
He said the current structure mirrors prior cycle corrections, where price dipped another 9% at most before reversing higher.
On the three-day chart, RSI has fallen to levels last seen near the $25,000 bottom, reinforcing that downside momentum is stretched.
He added that standard Bitcoin corrections this cycle have ranged between 29% and 34%.
The market has now retraced about 30%, placing BTC directly inside its historical correction band.
He pointed to a dense support cluster built through two major downside wicks, calling it the "most likely area of reversal" unless price violates the low sweep zone beneath it.
ETH Nears Its Major Support Band
The analyst said Ethereum still has room to test the $2,880 to $2,850 liquidity pocket, which aligns with the top of its broader support zone.
ETH has corrected roughly 40% from its highs, far less than the 66% pullback that defined its prior cycle low.
He added that daily RSI is at the same level where ETH bottomed during the last major downturn.
ETH liquidity remains heavily concentrated above the market, with dense clusters between $4,000 and $5,700.
The analyst expects ETH to reclaim higher levels once the remaining low timeframe liquidity is cleared.
XRP Holds Multi Month Range As Liquidity Builds Above
XRP continues to defend its multi month range near $2.10.
The analyst noted that XRP has held above its seven year resistance turned support for more than a year, calling it an unusually strong structural sign.
XRP liquidity on the hourly chart sits near $2.03 to $2.05, but the densest blocks remain far above the market, extending toward $4.20 to $4.30.
He highlighted that XRP dominance has turned up after breaking out of a long downtrend and that the XRP to ETH pair closed above a level that capped it for months.
That move, he said, may signal early relative strength if broader market conditions improve.
Analyst Says Sentiment And Data Show Capitulation, Not A Cycle Top
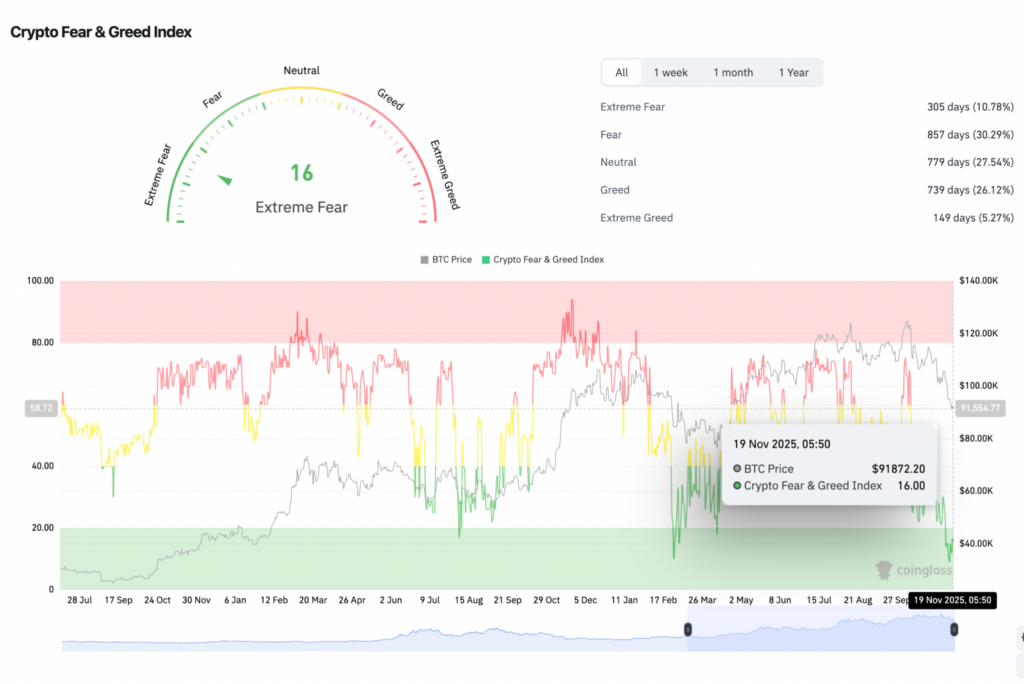
The fear and greed index sits at 16, matching levels that marked every major local bottom this cycle.
The alternative index printed 11 on Tuesday, which the analyst called a capitulation signal consistent with prior market turning points.
On Bitcoin dominance, he warned that continued weakness would typically precede altcoin outperformance, a pattern seen at the end of previous cycles.
He said the trend is not far enough along to signal cycle exhaustion, but it remains an important gauge in the coming weeks.
The analyst added that the largest liquidation event in cryptocurrency history occurred in early October, surpassing the scale of the FTX wipeout by a factor of ten.
He said XRP, ETH and BTC all reclaimed their structures after the liquidation spike, calling the recovery a sign of strong underlying demand.
Liquidity Above Remains The Key Driver For BTC, ETH And XRP
The analyst emphasized that the densest liquidity zones across the top three cryptocurrencies sit above current prices.
He expects markets to eventually target those levels, arguing that exchanges and market makers benefit from driving price into areas where contracts cluster.
He said the next two weeks will be critical as Bitcoin tests whether it holds the support cluster and whether ETH completes its liquidity sweep toward $2,85.
XRP's structure, he added, remains intact as long as it closes weekly candles above $2.