Options Corner: Profiting From The 'Hidden Geometry' Of SoFi Technologies
Author: Josh Enomoto | November 19, 2025 03:56pm
With the broader market continuing to show signs of weakness, financial technology (fintech) powerhouse SoFi Technologies Inc(NASDAQ:SOFI) suffered a choppy session on Wednesday. In particular, investors are anxiously awaiting the Federal Reserve's stance on the benchmark interest rate. Combined with risk-off behaviors negatively impacting growth-oriented enterprises, SOFI stock has tumbled over the past week. Still, the red ink could hide an intriguing contrarian opportunity.
One of the overlooked difficulties in assessing market behaviors — especially for options trading — is the constant kinetic nature of the equities arena. In practically every retail-friendly chart or graph, price is reflected as a function of time. Even in fundamental analysis, financial metrics (such as earnings per share or revenue) follow the same format.
It's really a product of the social evolution of humanity. Early humans observed changing seasons, animal migration patterns and day-night cycles, among myriad other events. In other words, people evolved to understand the world through sequences in time. As such, we investors and traders like to think in terms of earnings cycles and seasonality trends — these are time-based functions.
At the same token, we're really terrible at understanding probability because the concept is abstract. It doesn't help that probability is nonlinear and non-sequential. In contrast, we gravitate toward price charts because they tell a story.
However, the problem with time-based systems like fundamental and technical analysis is that while a time measurement is fixed, the market (when it's open) is constantly evolving. It's like trying to measure a tidal wave with a ruler. Time-based systems are useful for measuring fixed objects such as buildings. For measuring a kinetic substance, we need an entirely new framework.
Deciphering The Fluid Geometry Behind SOFI Stock
Quantitative analysis separates itself from the fundamental and technical approaches by attempting to measure the probability or the statistical structure of future motion. This is categorically different from technical analysis, which measures the motion itself as a property of time.
What's more, under the specific system I use — which is a Kolmogorov-Markov framework layered with kernel density estimations (KM-KDE) — price is analyzed as a function of probability density. Mathematically, this means that I don't view price as a singular journey across time. Instead, I break price data into hundreds (sometimes thousands) of rolling sequences at a defined interval.
Fundamentally, the idea here is that over enough trials, certain behaviors become evident, with prices clustering at certain points more so than others. This is the peak clustering effect that you see on a distributional curve. We also know through GARCH (Generalized Autoregressive Conditional Heteroskedasticity) studies that the diffusional properties of volatility depend on prior volatile events.
As such, specific signals — such as extended sessions of buying or selling transactions — can create different behaviors. These kinetic differences can be measured through bespoke algorithmic programs that conduct KDEs, thus exposing the hidden geometry behind every publicly traded security.
In recent Options Corner articles, I have discussed the concept of "informational arbitrage." I use this term because, right now, the financial publication industry has no concept of probability density as a function of price. We could very well be 15 to 20 years ahead of the industry — that's no joke.
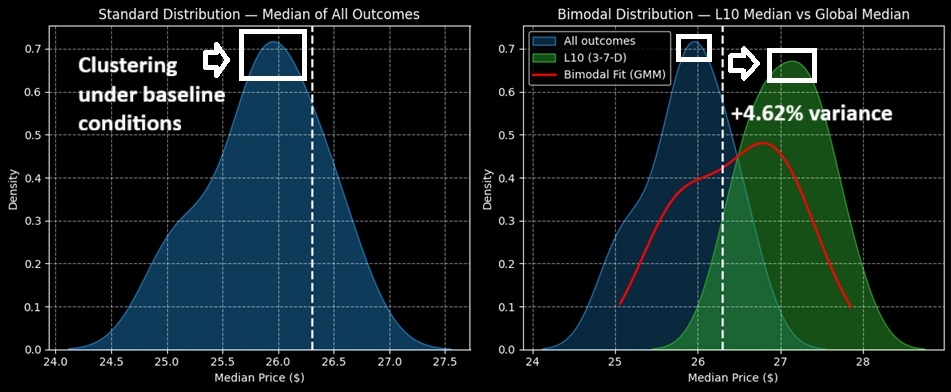
Image by author
Getting back to SOFI stock, using the KM-KDE approach referenced above, the probabilistic distribution of outcomes over the next 10 weeks would likely come out to between $24.20 and $27.60 (assuming an anchor price of $25.30). Further, price clustering would likely be predominant at just under $26.
The above assessment aggregates all data since SoFi's public market debut. However, we're interested in the market response related to the current signal, which is a 3-7-D formation; that is, in the trailing 10 weeks, SOFI stock printed three up weeks and seven down weeks, with an overall downward slope.
Under this sequence, the probabilistic expectations shift positively, with outcomes likely to range between $25.50 and $28.80. Moreover, price clustering would likely be predominant at $27.20. And that right there is the hidden geometry or informational arbitrage, where the probability density may land 4.62% above what would normally be expected.
Taking The Smart Wager
Using the market intelligence above, the smartest idea may be to consider the 26/27 bull call spread expiring Jan. 16. This trade involves two simultaneous transactions: buy the $26 call and sell the $27 call, for a net debit paid of $52 (the most that can be lost). Both these transactions should occur on the same combined ticket.
If SOFI stock rises through the second-leg strike ($27) at expiration, the maximum profit would come out to $48, translating to a payout of over 92%. Breakeven would land at $26.52, making this trade contextually realistic — assuming, of course, that the quantitative premise pans out.
A more aggressive idea is to consider the 26/28 bull spread, also expiring Jan. 16. This trade features a breakeven price of $26.92, which appears to be a contextually realistic target. Further, the payout is enticing at over 117%. Of course, the issue comes down to triggering the higher strike, which is quite ambitious because it's on the far end of the distribution. Still, for some traders, the enhanced reward might be worth it.
The opinions and views expressed in this content are those of the individual author and do not necessarily reflect the views of Benzinga. Benzinga is not responsible for the accuracy or reliability of any information provided herein. This content is for informational purposes only and should not be misconstrued as investment advice or a recommendation to buy or sell any security. Readers are asked not to rely on the opinions or information herein, and encouraged to do their own due diligence before making investing decisions.