The weekly chart is repeating the same rounded arc that defined Dogecoin's last major reversal, but with a key difference.
The prior arc only carried price to roughly $0.50 before momentum took over.
This new arc is forming deeper along the rising support line and carries a steeper curvature, creating a structure that aligns more closely with a push toward the $0.80 zone.
The symmetry between the two arcs is clear, yet the current version has more room above it, setting the stage for a larger extension if buyers defend the support base.
On-balance volume remains elevated near 55 billion, showing that long-duration participation has not collapsed during this year's correction.
When DOGE enters weekly compression with OBV holding firm, the token often sets the foundation for its next expansion phase.
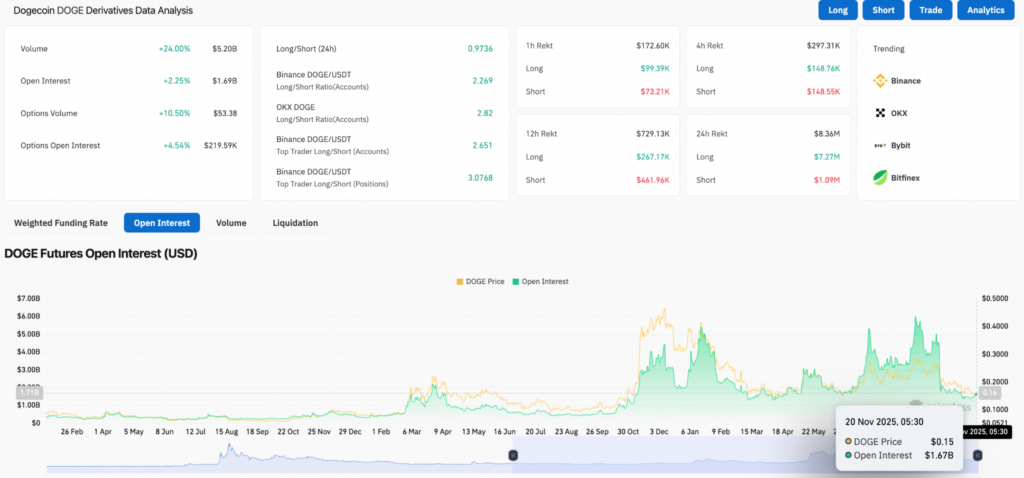
Derivative volume is up 24% to $5.20 billion, signaling renewed activity after weeks of contraction.
Open interest has risen to $1.69 billion, up 2.25%, showing traders are beginning to add exposure again instead of unwinding.
Options volume is up 10.50%, while options open interest has climbed 4.54%, indicating increasing demand for directional positioning.
Despite this build-up, volatility pricing remains moderate, suggesting traders expect a decisive move but are not bracing for disorder.
The long/short ratios paint a clear picture: top traders remain aggressively positioned to the long side, with long/short readings between 2.26 and 3.07 across major exchanges.
Liquidations remain light, with the past 24 hours showing only $8.36M in total liquidations — not enough to indicate forced selling or panic leverage flushing.
DOGE futures open interest currently sits near $1.67 billion, matching the broader trend of steady re-accumulation rather than capitulation.
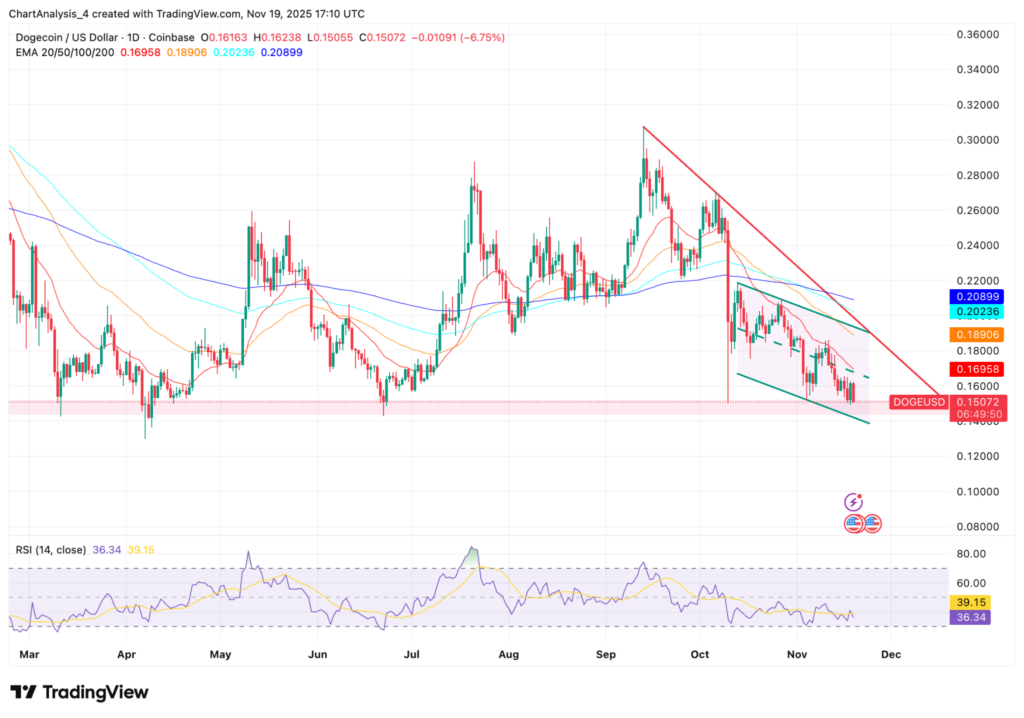
Key Levels To Watch
Dogecoin's immediate line in the sand is $0.145.
A daily close below that level would expose the lower weekly trendline near $0.12 and invalidate the developing arc.
If buyers hold the zone, the next checkpoint is a reclaim of $0.16, followed by a break above the descending trendline that has capped every short-term rebound.
The larger signal sits on the weekly timeframe.
The new arc forming along rising support is broader and deeper than the one that topped near $0.50 last cycle.
If the pattern completes, the structural extension points toward the $0.75–$0.80 region, matching the upper arc projection shown on the chart.