Understanding Amazon.com's Position In Broadline Retail Industry Compared To Competitors
Author: Benzinga Insights | November 20, 2025 10:00am
In today's rapidly evolving and fiercely competitive business landscape, it is crucial for investors and industry analysts to conduct comprehensive company evaluations. In this article, we will undertake an in-depth industry comparison, assessing Amazon.com (NASDAQ:AMZN) alongside its primary competitors in the Broadline Retail industry. By meticulously examining crucial financial indicators, market positioning, and growth potential, we aim to provide valuable insights to investors and shed light on company's performance within the industry.
Amazon.com Background
Amazon is the leading online retailer and marketplace for third party sellers. Retail related revenue represents approximately 74% of total, followed by Amazon Web Services (17%), and advertising services (9%). International segments constitute 22% of Amazon's total revenue, led by Germany, the United Kingdom, and Japan.
| Company |
P/E |
P/B |
P/S |
ROE |
EBITDA (in billions) |
Gross Profit (in billions) |
Revenue Growth |
| Amazon.com Inc |
31.45 |
6.44 |
3.48 |
6.02% |
$45.5 |
$91.5 |
13.4% |
| Alibaba Group Holding Ltd |
18.31 |
2.66 |
2.71 |
4.26% |
$53.52 |
$111.22 |
1.82% |
| PDD Holdings Inc |
12.17 |
3.04 |
2.97 |
8.89% |
$25.79 |
$58.13 |
7.14% |
| MercadoLibre Inc |
50.70 |
16.94 |
4.02 |
7.06% |
$0.88 |
$3.21 |
39.48% |
| Sea Ltd |
62.68 |
8.33 |
4.31 |
3.77% |
$0.48 |
$2.6 |
38.3% |
| Coupang Inc |
130.48 |
10.56 |
1.52 |
2.02% |
$0.32 |
$2.72 |
17.81% |
| JD.com Inc |
9.65 |
1.26 |
0.24 |
2.3% |
$7.36 |
$50.47 |
14.85% |
| eBay Inc |
18.02 |
7.79 |
3.60 |
13.35% |
$0.74 |
$2.0 |
9.47% |
| Vipshop Holdings Ltd |
10.38 |
1.73 |
0.68 |
3.74% |
$1.91 |
$6.05 |
-3.98% |
| Dillard's Inc |
16.46 |
4.62 |
1.44 |
6.55% |
$0.14 |
$0.58 |
-2.93% |
| Ollie's Bargain Outlet Holdings Inc |
34.69 |
4.11 |
3.03 |
3.49% |
$0.09 |
$0.27 |
17.49% |
| MINISO Group Holding Ltd |
19.35 |
4.10 |
2.44 |
4.56% |
$0.73 |
$2.2 |
23.07% |
| Global E Online Ltd |
884.38 |
6.44 |
6.93 |
1.17% |
$0.02 |
$0.1 |
27.9% |
| Macy's Inc |
11.03 |
1.17 |
0.24 |
1.95% |
$0.36 |
$2.1 |
-1.9% |
| Kohl's Corp |
8.28 |
0.44 |
0.11 |
3.97% |
$0.45 |
$1.53 |
-4.98% |
| Hour Loop Inc |
60.67 |
8.35 |
0.45 |
7.15% |
$0.0 |
$0.02 |
7.56% |
| Average |
89.82 |
5.44 |
2.31 |
4.95% |
$6.19 |
$16.21 |
12.74% |
By closely examining Amazon.com, we can identify the following trends:
-
A Price to Earnings ratio of 31.45 significantly below the industry average by 0.35x suggests undervaluation. This can make the stock appealing for those seeking growth.
-
It could be trading at a premium in relation to its book value, as indicated by its Price to Book ratio of 6.44 which exceeds the industry average by 1.18x.
-
The stock's relatively high Price to Sales ratio of 3.48, surpassing the industry average by 1.51x, may indicate an aspect of overvaluation in terms of sales performance.
-
The Return on Equity (ROE) of 6.02% is 1.07% above the industry average, highlighting efficient use of equity to generate profits.
-
The company has higher Earnings Before Interest, Taxes, Depreciation, and Amortization (EBITDA) of $45.5 Billion, which is 7.35x above the industry average, indicating stronger profitability and robust cash flow generation.
-
The gross profit of $91.5 Billion is 5.64x above that of its industry, highlighting stronger profitability and higher earnings from its core operations.
-
With a revenue growth of 13.4%, which surpasses the industry average of 12.74%, the company is demonstrating robust sales expansion and gaining market share.
Debt To Equity Ratio
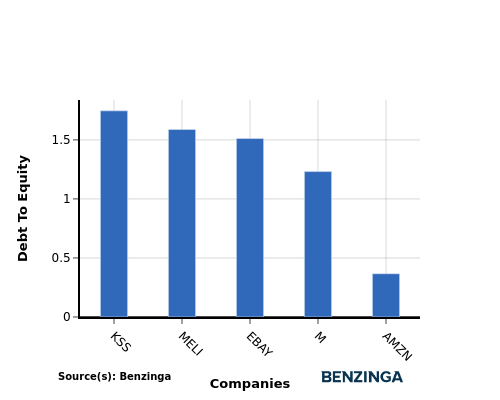
The debt-to-equity (D/E) ratio measures the financial leverage of a company by evaluating its debt relative to its equity.
Considering the debt-to-equity ratio in industry comparisons allows for a concise evaluation of a company's financial health and risk profile, aiding in informed decision-making.
When comparing Amazon.com with its top 4 peers based on the Debt-to-Equity ratio, the following insights can be observed:
-
In terms of the debt-to-equity ratio, Amazon.com has a lower level of debt compared to its top 4 peers, indicating a stronger financial position.
-
This implies that the company relies less on debt financing and has a more favorable balance between debt and equity with a lower debt-to-equity ratio of 0.37.
Key Takeaways
The low P/E ratio suggests Amazon.com may be undervalued compared to its peers in the Broadline Retail industry. A high P/B ratio indicates the market values Amazon.com's assets highly. The high P/S ratio implies investors are willing to pay a premium for Amazon.com's sales. Amazon.com's high ROE, EBITDA, gross profit, and revenue growth indicate strong financial performance relative to industry peers.
This article was generated by Benzinga's automated content engine and reviewed by an editor.
Posted In: AMZN