Bitcoin Crashes To $88,000 But Cardano's Charles Hoskinson Says The Path To $250,000 Is 'Locked In'
Author: Parshwa Turakhiya | November 20, 2025 01:23pm
Bitcoin (CRYPTO: BTC) has plummeted below $88,00, but Cardano’s(CRYPTO: ADA) Charles Hoskinson says everything points to $250,000 by late 2026.
Hoskinson Calls BTC's Next Two Quarters ‘Downside Clearing'
Speaking during a Squawk Box Europe segment on Tuesday, Hoskinson said the market is still digesting macro pressures, including tariff-driven uncertainty and uneven economic momentum.
He noted that "the next two quarters" will likely clear the remaining downside before Bitcoin resumes its long-term trajectory toward $250,000.
Hoskinson pointed to the post-halving timing structure.
He said previous Bitcoin patterns typically show major upside 400 to 600 days after a halving event, placing 2026 inside the historically strong window.
He also highlighted institutional participation, mentioning that BlackRock Inc.(NYSE:BLK), Goldman Sachs Group Inc.(NYSE:GS), Morgan Stanley(NYSE:MS) and a more crypto-friendly U.S. administration are supporting broader adoption.
Institutional Flows And Real-World Asset Integration
Hoskinso said this cycle differs from prior four-year cycles because institutional money, exchange-traded products, and tokenized real-world assets now contribute significantly to Bitcoin demand.
He argued that previous cycles were led almost entirely by retail, while the current environment shows higher structural inflows.
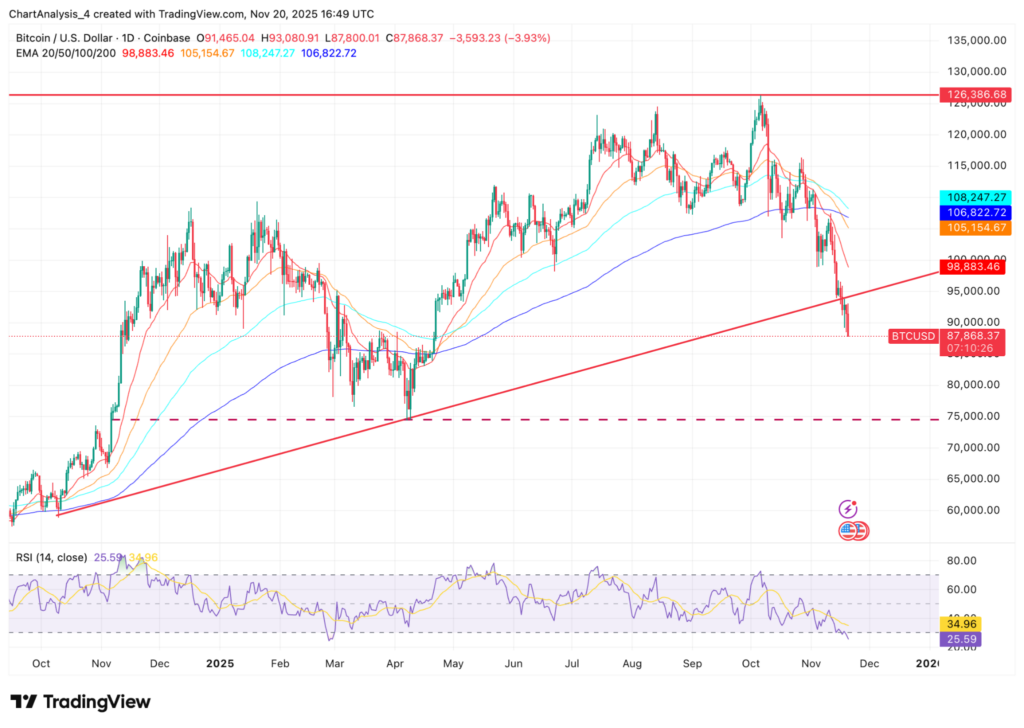
The next major support zone sits around $75,000, the midpoint of last year's consolidation and the base of the prior breakout.
A weekly close below the multi-year trendline increases the probability of a move toward the $80,000 to $75,000 band.
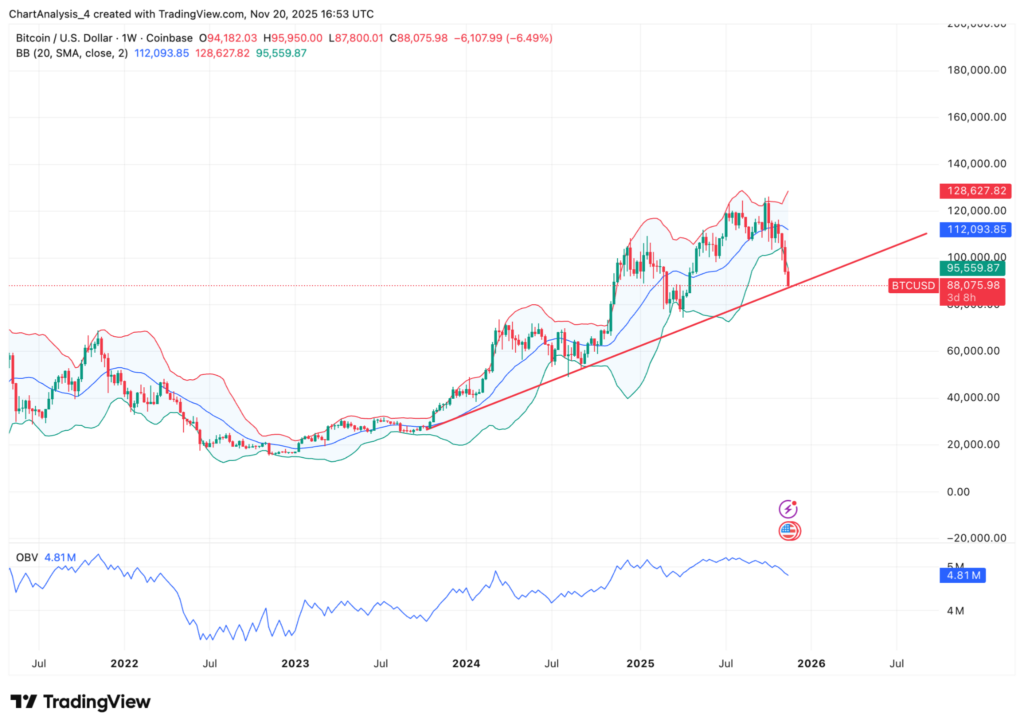
On the weekly chart, Bitcoin is sliding toward the lower Bollinger Band as volatility expands.
On-balance volume has begun to turn lower after holding firm earlier in the year, signaling distribution as sellers dominate spot flows.
Why It Matters
Bitcoin is flashing a rare combination of structural breakdown and long-horizon conviction that rarely appears in the same cycle.
The multi-year trendline loss on the chart mirrors every major reset since 2015, yet long-term capital — from institutions to ETF issuers — continues flowing in ways that didn't exist in prior cycles.
When a macro voice like Hoskinson calls the next two quarters "downside clearing," it reframes the breakdown not as exhaustion but as an institutional accumulation window.
If that view holds, the $75,000 zone on the chart becomes less a floor and more the entry point for a 2026 trajectory that larger players already consider inevitable.