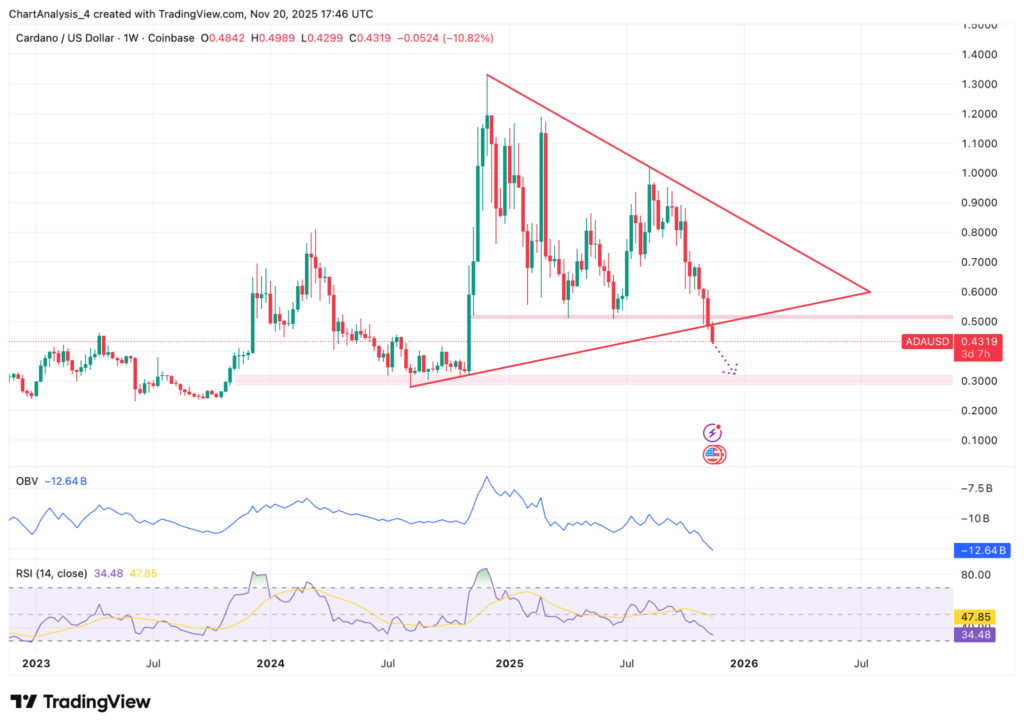
ADA has slipped below the long-standing weekly trendline that supported its past two bull recoveries.
The break shifts the structure into a distribution phase, with price now testing the $0.40 region that served as a launchpad during earlier rallies.
On-balance volume has been declining for months, signaling that long-term holders are reducing exposure instead of absorbing sell pressure.
The weekly RSI sits near 34, showing continued weakness without reaching conditions linked to major reversals.
The broader pattern resembles a multi-quarter symmetrical triangle that has now failed on the downside.
ADA lost its final higher-low anchor near $0.48 and slid into the mid-$0.30s demand band, aligning with earlier cycle pivot levels.
Triangle Failure Points Toward $0.32 To $0.36 Zone
The measured extension of the failed weekly triangle aligns with the $0.32 to $0.36 region, a zone that marks the deepest liquidity pocket on the historical volume profile.
The reaction there will help determine whether ADA is nearing capitulation or entering a prolonged undervaluation phase similar to early 2023.
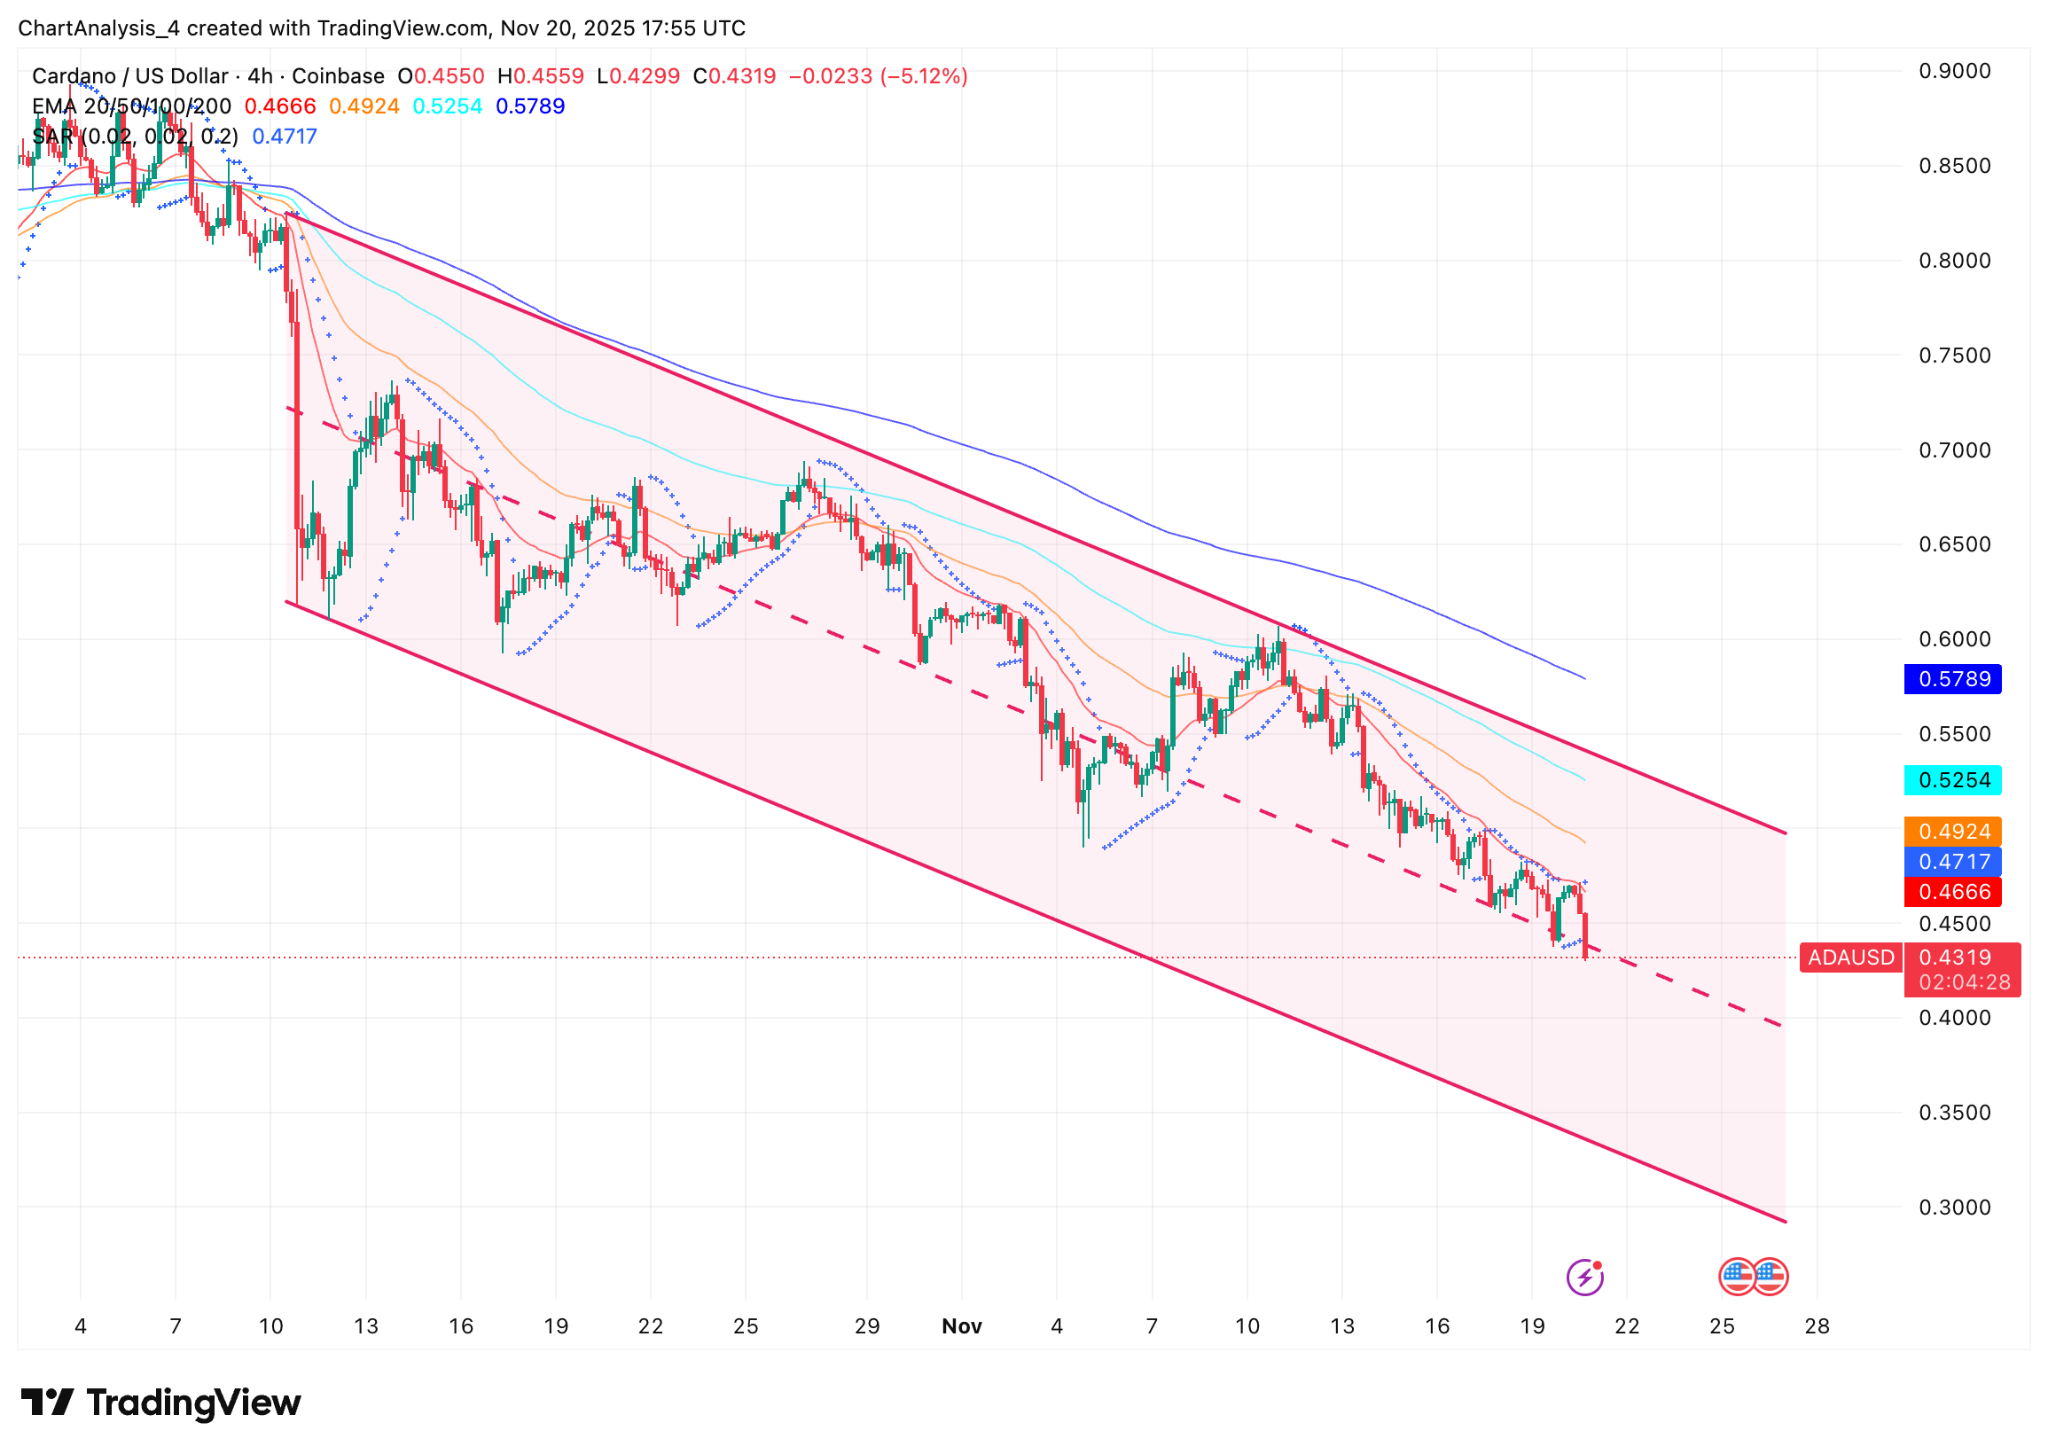
The 4-hour structure remains locked inside a descending channel with clean lower highs forming along the upper boundary.
Every recovery attempt has rejected at the 20 EMA, now near $0.4666. The 50 EMA at $0.4924 and the 200 EMA at $0.5789 remain well above current levels.
Parabolic SAR remains above price across intraday frames, confirming that sellers continue to control short-term direction.
The lower boundary of the channel allows room for a test of $0.38 without breaking the downtrend.
Broader market sentiment remains fragile as Bitcoin(CRYPTO: BTC) slides to $86,500 with a sharp 5% drop, and Ethereum (CRYPTO: ETH) trades near $2,820 while sitting on its most critical support zone of the quarter.
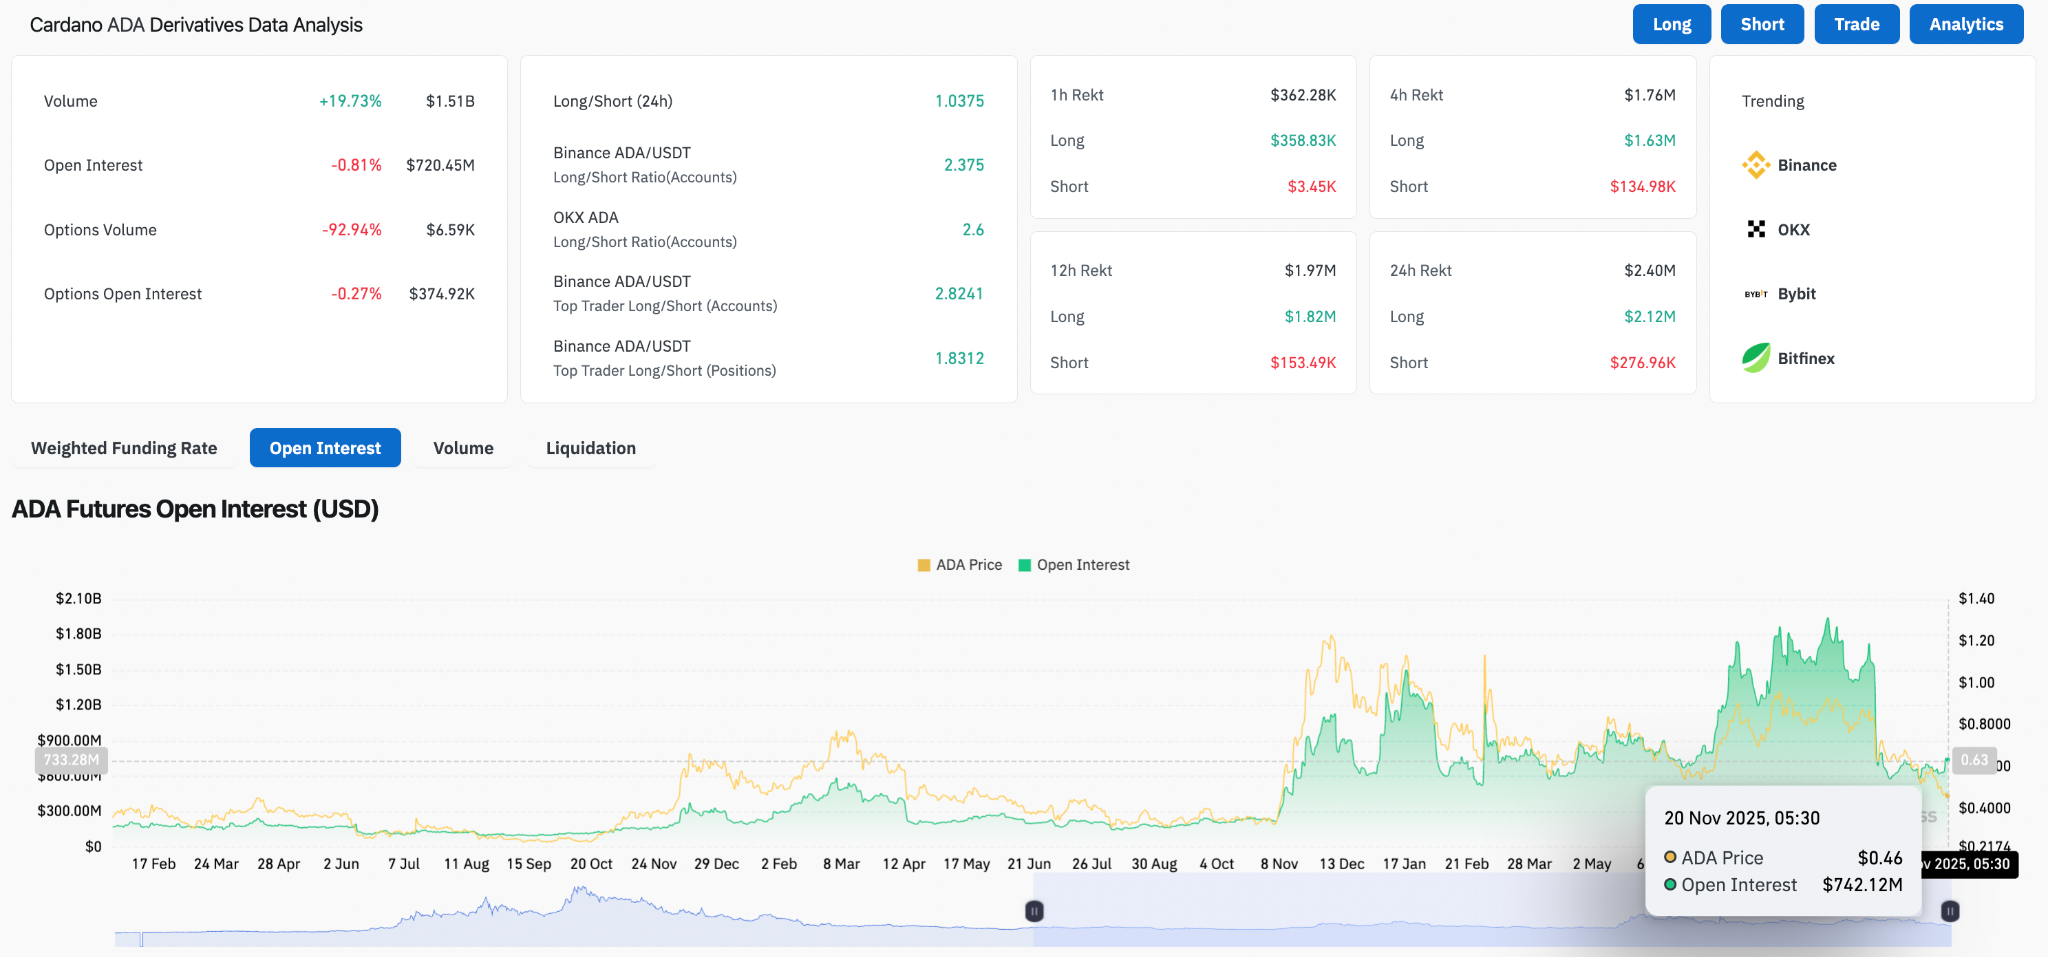
Open interest has slipped to about $742 million, slightly lower but still elevated relative to earlier phases of the year.
Long-short ratios on major venues such as Binance and OKX range from 1.83 to 2.82, indicating that bullish traders are attempting to buy dips aggressively.
This imbalance increases the risk of forced long liquidations if ADA continues to weaken.
About $1.76 million in liquidations were recorded over the past 24 hours, mostly from long positions, reinforcing downside pressure.
A break below $0.40 could trigger additional unwinding across leveraged books and accelerate movement toward the deeper $0.36 to $0.32 liquidity zone.