Stellar Nvidia Earnings No Match For Crypto Margin Calls; Rising Japan Yields Hurting the Carry Trade
Author: The Arora Report | November 21, 2025 11:48am
To gain an edge, this is what you need to know today.
Market Cross Currents
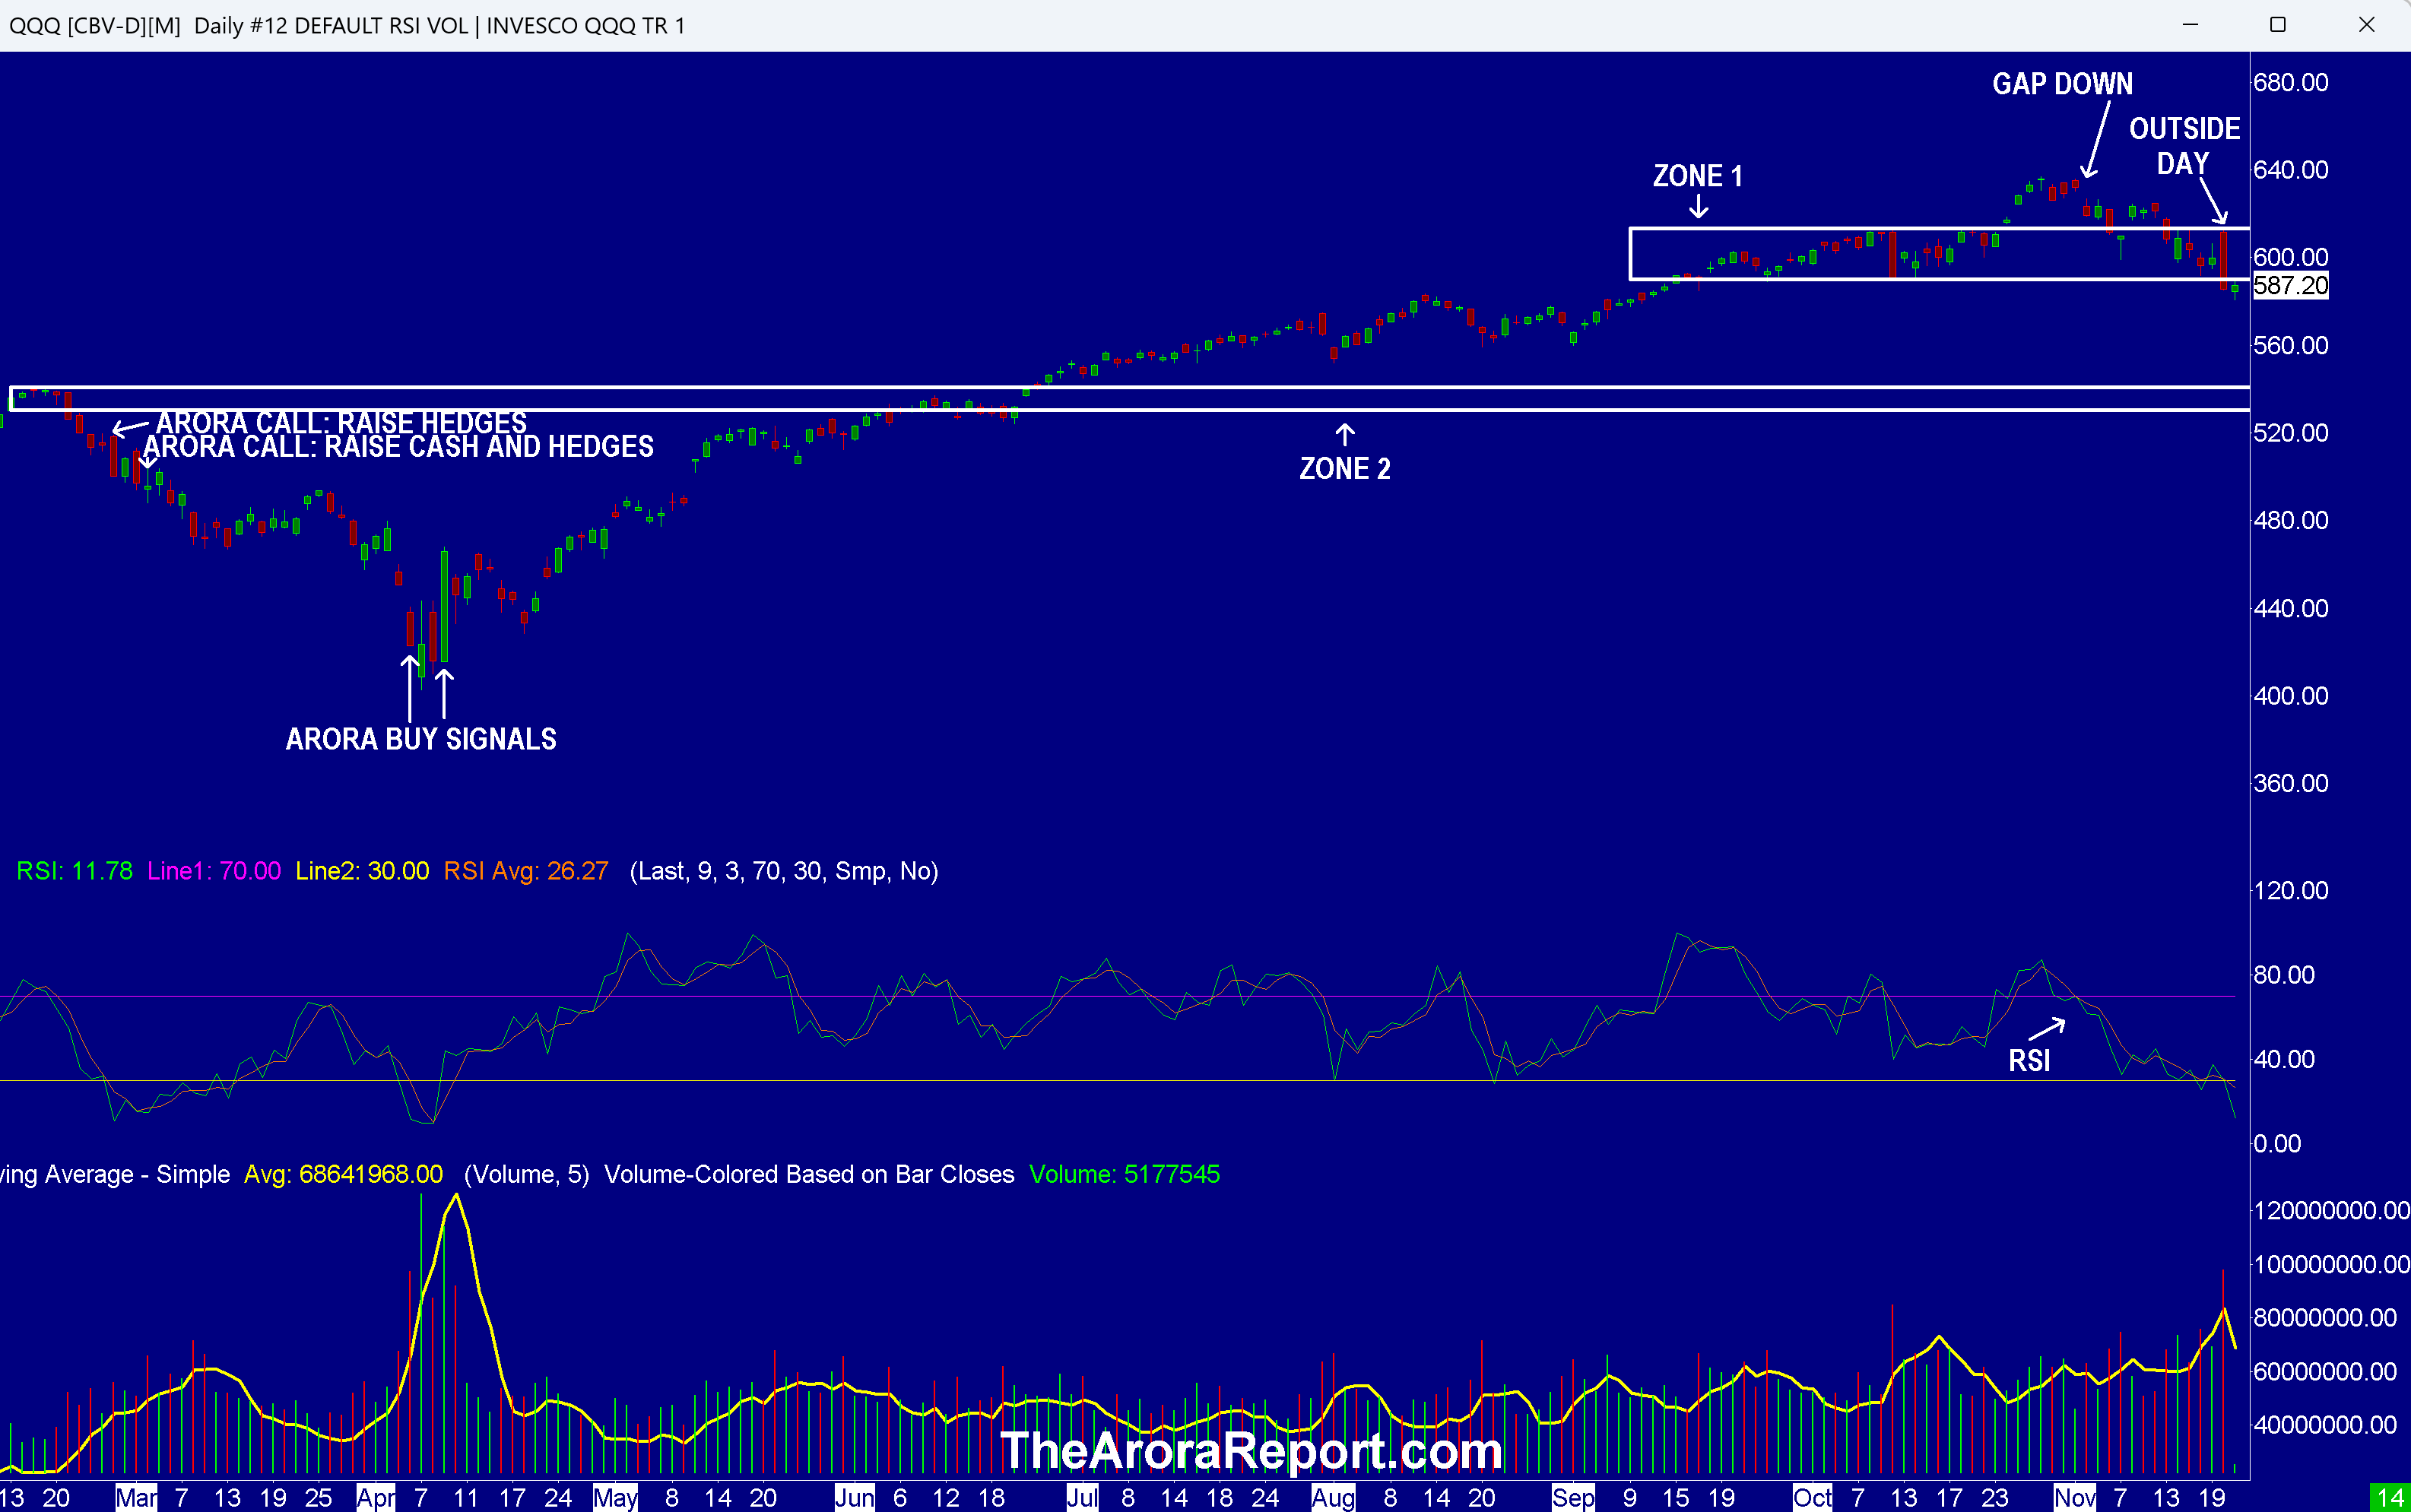
Please click here for an enlarged chart of Invesco QQQ Trust Series 1(NASDAQ:QQQ).
Note the following:
The chart shows an outside day in QQQ yesterday. An outside day occurs when the high of the day is higher than the prior day's high and the low of the day is lower than the prior day's low. An outside day is a reversal pattern.
The chart shows QQQ fell below the low band of zone 1. Zone 1 was previously a support zone and is now a resistance zone.
RSI on the chart shows QQQ is oversold.
The chart shows QQQ started out lower this morning but moved up as buying came in on New York Fed President John Williams's comments. Williams sees room for a rate cut and does not believe that a rate cut will impact inflation.
As per Fed rate futures, the probability of a rate cut in December jumped from 34% to 50% after Williams's comment.
Later on, Boston Fed President Collins said that she is reluctant to cut rates in December but is open to new data.
Investors should note, the stock market moved up on Williams's comments but ignored Collins's comments.
There were four catalysts behind yesterday becoming an outside day.
The morning started out with aggressive buying due to stellar NVIDIA Corp (NASDAQ:NVDA) earnings.
It appears that many funds sold into the strength due to rising yields in Japan. The concern is the carry trade may blow up if yields in Japan rise further. As such prudent investors are taking protective steps. In the carry trade, funds have been borrowing in Japan and buying AI stocks in the U.S. We have been sharing with you the importance of the carry trade to the U.S. stock market.
Bitcoin promoters had been putting up a ferocious fight for bitcoin to hold $90,000. When bitcoin fell below $90,000, it triggered margin calls. Many investors are using leverage of 10-20 times in crypto trading. Such high leverage is very painful when cryptos fall. Many investors who own cryptos also own NVDA and other AI stocks. Further, many trading algorithms are keyed to bitcoin. Such algorithms started selling when bitcoin dropped below $80,000. Bitcoin ETFs saw $800M of outflows yesterday.
Yesterday, many investors started waking up to these concerns about circular financing in AI and super aggressive depreciation schedules for AI chips.
Magnificent Seven Money Flows
Most portfolios are now heavily concentrated in the Mag 7 stocks. For this reason, it is important to pay attention to early money flows in the Mag 7 stocks on a daily basis.
In the early trade, money flows are positive in Amazon.com, Inc.(NASDAQ:AMZN), Alphabet Inc Class C(NASDAQ:GOOG), Nvidia (NVDA), and Tesla Inc(NASDAQ:TSLA).
In the early trade, money flows are neutral in Meta Platforms Inc(NASDAQ:META), and Microsoft Corp (NASDAQ:MSFT).
In the early trade, money flows are negative in Apple Inc (NASDAQ:AAPL).
In the early trade, money flows are mixed in SPDR S&P 500 ETF Trust(NYSE:SPY) and Nasdaq 100 ETF (QQQ).
Momo Crowd And Smart Money In Stocks
Investors can gain an edge by knowing money flows in SPY and QQQ. Investors can get a bigger edge by knowing when smart money is buying stocks, gold, and oil. The most popular ETF for gold is SPDR Gold Trust (GLD). The most popular ETF for silver is iShares Silver Trust (SLV). The most popular ETF for oil is United States Oil ETF (USO).
Consider continuing to hold good, very long term, existing positions. Based on individual risk preference, consider a protection band consisting of cash or Treasury bills or short-term tactical trades as well as short to medium term hedges and short term hedges. This is a good way to protect yourself and participate in the upside at the same time.
You can determine your protection bands by adding cash to hedges. The high band of the protection is appropriate for those who are older or conservative. The low band of the protection is appropriate for those who are younger or aggressive. If you do not hedge, the total cash level should be more than stated above but significantly less than cash plus hedges.
A protection band of 0% would be very bullish and would indicate full investment with 0% in cash. A protection band of 100% would be very bearish and would indicate a need for aggressive protection with cash and hedges or aggressive short selling.
It is worth reminding that you cannot take advantage of new upcoming opportunities if you are not holding enough cash. When adjusting hedge levels, consider adjusting partial stop quantities for stock positions (non ETF); consider using wider stops on remaining quantities and also allowing more room for high beta stocks. High beta stocks are the ones that move more than the market.
Traditional 60/40 Portfolio
Probability based risk reward adjusted for inflation does not favor long duration strategic bond allocation at this time.
Those who want to stick to traditional 60% allocation to stocks and 40% to bonds may consider focusing on only high quality bonds and bonds of five year duration or less. Those willing to bring sophistication to their investing may consider using bond ETFs as tactical positions and not strategic positions at this time.
The Arora Report is known for its accurate calls. The Arora Report correctly called the big artificial intelligence rally before anyone else, the new bull market of 2023, the bear market of 2022, new stock market highs right after the virus low in 2020, the virus drop in 2020, the DJIA rally to 30,000 when it was trading at 16,000, the start of a mega bull market in 2009, and the financial crash of 2008. Please click here to sign up for a free forever Generate Wealth Newsletter.
Benzinga Disclaimer: This article is from an unpaid external contributor. It does not represent Benzinga’s reporting and has not been edited for content or accuracy.