Jim Cramer Says Market Bounce Makes 'No Sense' As Bitcoin Reels From $1B Liquidation Wave
Author: Parshwa Turakhiya | November 21, 2025 12:19pm
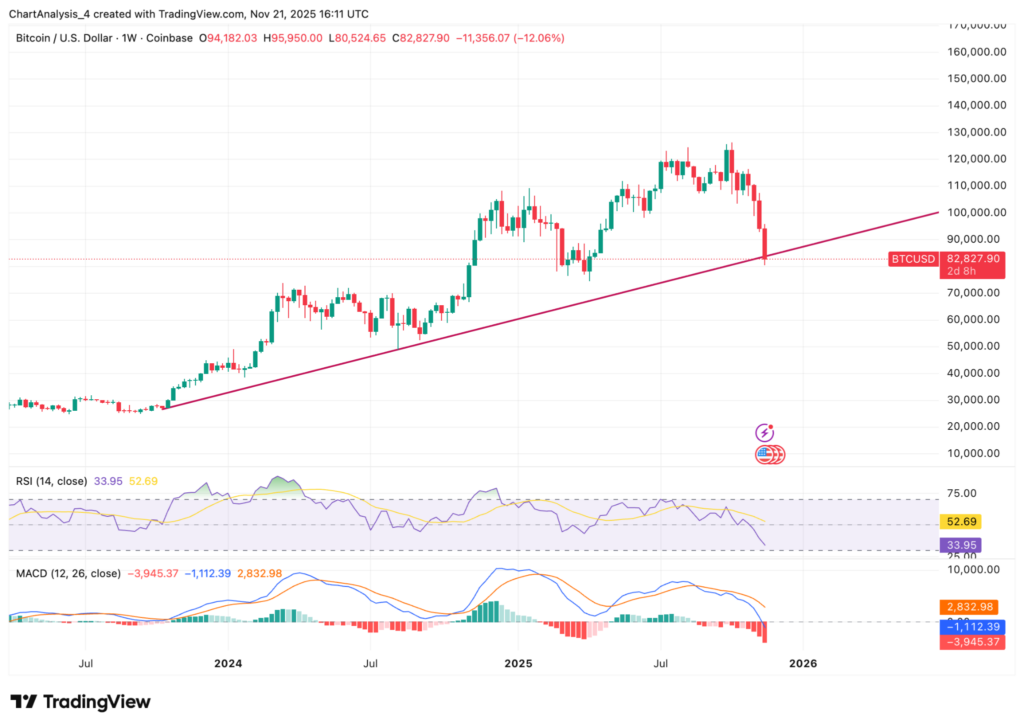
Jim Cramer says traders clinging to Fed-driven optimism are delusional as Bitcoin (CRYPTO: BTC) traded as low as $81,000 on Friday.
Cramer Says Fed Optimism Is Misplaced
CNBC host Jim Cramer on Friday said traders were wrong to assume that conditions improved after Federal Reserve board member John Williams spoke.
He argued that nothing meaningful changed and that many market participants still "need to get out."
Cramer said the latest bounce attempt made "no sense," adding that this is not a moment where anyone can "wave a magic wand" to repair the damage.
He pointed to ongoing issues tied to data-center buildouts and structural risks across trading strategies.
The downturn intensified when the United States stumbled on its October jobs report, sparking a fast unwind across risk markets.
Liquidations Spike As Bitcoin Extends Its Breakdown
The market saw $2.24 billion in total liquidations over 24 hours, with Bitcoin accounting for $1.16 billion according to Coinglass.
This marks one of the heaviest liquidation clusters of the year and reflects widespread forced selling.
Earlier, Bloomberg analyst Mike McGlonewarned that Bitcoin's current structure resembles its 2018 breakdown, when the asset unwound sharply after losing long-term support.
He said the chart "looks similar to the last major unwind" and suggested price could fall as low as $10,000 if momentum fully breaks.
Crypto Cheerleaders Called Out
Cramer also criticized what he called "consistent bullish crypto cheerleaders" who continue to push long-term price targets such as $1 million per Bitcoin.
Although he did not name individuals directly, the comments referenced Ark Invest CEO Cathie Wood, who has long argued that Bitcoin's fixed supply and institutional adoption could push it to $1 million by 2030.
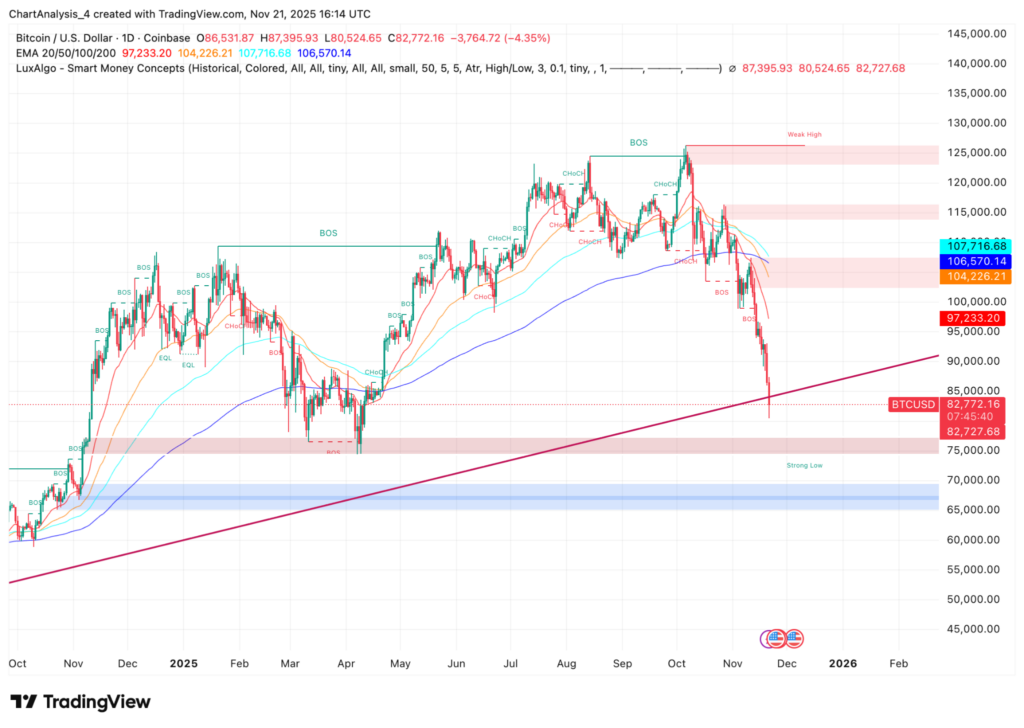
If selling continues, the next large support cluster sits between $70,000 and $75,000, a region that served as a major demand zone in previous cycles.
This band also matches the strong-low area highlighted on your chart.
For buyers to regain control, Bitcoin must reclaim the lost trendline and push back above the 20-day and 50-day averages, currently near $97,000–$104,000.
Until then, every bounce risks forming another lower high.