The Insider Report: Prepare for the Next Dip Buying Opportunity
Author: Gianni di Poce | November 23, 2025 04:28pm
Market Overview
The turbulence in stocks continued with the Nasdaq reeling from the tech wreck. It finished down 2.74%, while the Dow Jones Industrial Average and the S&P 500 finished down 1.91% and 1.94%, respectively. The rotation into healthcare continues to accelerate, and it's really the only sector offering abundant and attractive opportunities. Even so, this selloff looks extended and we are due for a bounce. Crypto, however, has some issues. It's basically do or die at this point.
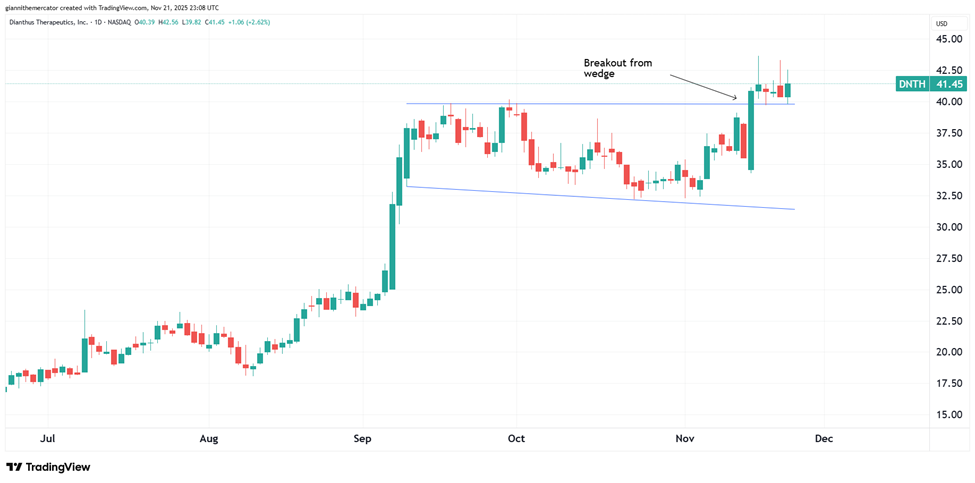
Dianthus Therapeutics, Inc. (DNTH) is a leading clinical-stage biotechnology company focused on developing novel monoclonal antibodies targeting the complement system for severe autoimmune and inflammatory diseases, offering investors exposure to the rapidly growing immunology and precision medicine sector with a focus on innovative therapies like DNTH103 for conditions such as generalized myasthenia gravis and chronic inflammatory demyelinating polyneuropathy.
The previous quarter showed revenue of $396k and a loss of $36.77 million.
This valuation on DNTH is abysmal. Price-to-Sales is a whopping 486.21 and Book Value is just 12.75.
From a technical standpoint, DNTH just broke out from a wedge pattern, which points to a big acceleration in upside momentum.
Why It's Happening
Dianthus Therapeutics Inc. is pioneering next-generation complement therapeutics for severe autoimmune diseases, with its lead candidate DNTH103—a highly potent, selective monoclonal antibody—advancing rapidly through multiple Phase 2 trials in underserved neuromuscular conditions like generalized myasthenia gravis (gMG) and chronic inflammatory demyelinating polyneuropathy (CIDP). This innovative approach targets the root cause of inflammation with subcutaneous dosing every two weeks, addressing critical unmet needs in markets projected to exceed $10 billion by 2030 and positioning Dianthus as a potential leader in precision immunology.
Breakthrough Phase 2 data from the MaGic trial in gMG underscores DNTH103’s best-in-class potential, demonstrating robust efficacy in reducing symptoms and improving quality of life for patients with limited treatment options. With enrollment exceeding targets at 65 patients and top-line results released in September 2025, this milestone validates the program’s scientific foundation and accelerates the path to Phase 3, fueling a narrative of transformative impact in rare disease care.
Strategic pipeline acceleration in CIDP and multifocal motor neuropathy builds a neuromuscular franchise with multiple catalysts through year-end 2026. The proactive launch of a potentially registrational CIDP study, alongside ongoing trials, diversifies revenue prospects across high-value indications, creating a robust development roadmap that de-risks execution and taps into growing demand for complement-targeted therapies in immunology.
Strong institutional momentum reflects growing confidence in Dianthus’s trajectory, with prominent biotech investors like Baker Bros. Advisors and Braidwell LP adding or maintaining positions in Q3 2025 13F filings. This influx of sophisticated capital, alongside a $150 million public offering in September 2025, bolsters the company’s financial runway into 2027, enabling aggressive advancement without dilution pressures and signaling undervalued potential in the biotech sector.
Analyst Ratings:
HC Wainwright: Buy
Wedbush: Outperform
Truist Securities: Buy
My Action Plan (95% Return Potential)
I am bullish on DNTH above $35.00-$36.00. My upside target is $80.00-$82.00.
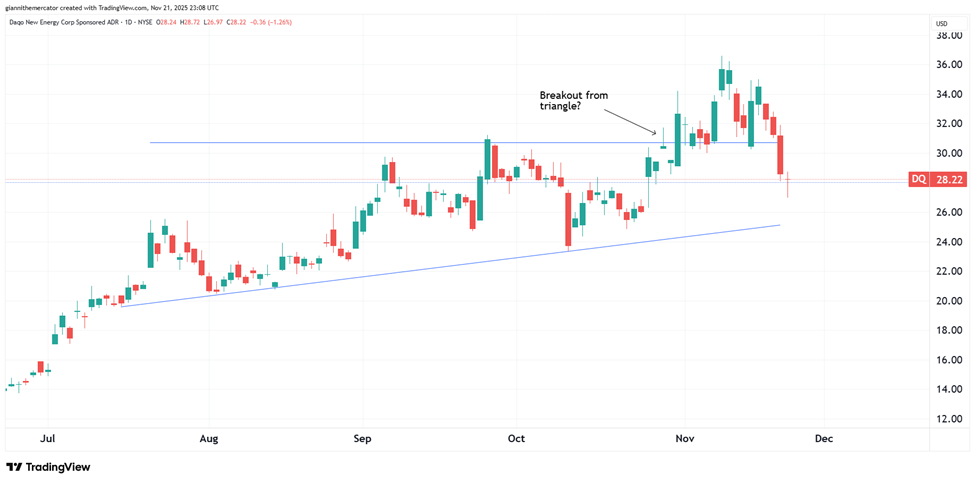
Daqo New Energy Corp. (DQ) is a leading manufacturer of high-purity polysilicon, a critical raw material for solar photovoltaic products, offering investors exposure to the rapidly growing renewable energy and solar power sector with a focus on advanced production processes and global sustainability initiatives.
The last quarterly report showed revenue of $244.60 million but no earnings.
Valuation is pretty strong in DQ. Price-to-Sales is around 3.60 but Book Value is 64.93, suggesting it's on sale.
From a technical perspective, DQ just broke out from an ascending triangle formation. This signals a continuation of the uptrend is in effect.
Why It's Happening
Daqo New Energy Corp. is riding the global solar power surge as a leading polysilicon producer, with its high-purity materials fueling the photovoltaic supply chain amid accelerating renewable energy adoption worldwide. As governments and corporations commit to net-zero goals, Daqo’s established production capacity positions it to benefit from the explosive growth in solar installations, projected to exceed 1 TW annually by 2030, creating a resilient narrative of essential infrastructure in the clean energy transition.
Operational resilience and cost efficiencies highlight Daqo’s competitive edge in a volatile market. Despite industry headwinds, the company’s focus on low-cost production in China has sustained profitability, with Q2 2025 results showcasing disciplined execution and a path to stabilizing margins as polysilicon prices recover, reinforcing its story as a battle-tested player ready to capitalize on the long-term upcycle in solar demand.
Strategic expansion into wafers diversifies Daqo’s revenue beyond polysilicon, tapping into higher-value segments of the PV ecosystem. The Polysilicon and Wafer segments enable vertical integration, reducing exposure to raw material price swings while capturing more of the value chain, positioning the company for enhanced growth as module manufacturers seek reliable, end-to-end suppliers in a fragmented market.
Geopolitical neutrality and global supply role strengthen Daqo’s international appeal. By serving photovoltaic manufacturers across Asia, Europe, and North America, the company navigates trade tensions through diversified customer base and technology leadership, building a narrative of indispensable reliability in the quest for energy independence and sustainable power solutions.
Analyst Ratings:
Roth Capital: Neutral
Citigroup: Buy
GLJ Research: Buy
My Action Plan (78% Return Potential)
I am bullish on DQ above $27.00-$28.00. My upside target is $50.00-$52.00.
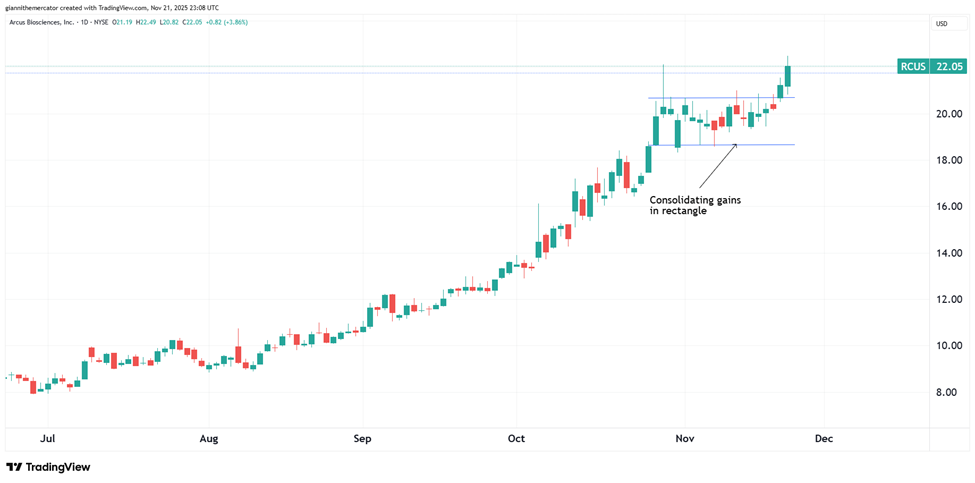
Arcus Biosciences, Inc. (RCUS) is a leading clinical-stage biopharmaceutical company developing differentiated molecules and combination therapies for cancer and inflammatory diseases, offering investors exposure to the rapidly growing oncology and immunology sector with a focus on innovative treatments like domvanalimab and casdatifan for lung cancer and renal cell carcinoma.
The company shared revenue of $26 million in their latest quarter, but still had a loss of $135 million.
Valuation in RCUS is sky-high. Price-to-Sales is at 8.38 and Book Value is just 3.52.
From a charting perspective, RCUS is consolidating its recent gains within a rectangle pattern, which points to more upside.
Why It's Happening
Arcus Biosciences Inc. is advancing its innovative TIGIT pathway inhibitors to transform cancer immunotherapy, with domvanalimab + zimberelimab demonstrating superior efficacy in Phase 3 NSCLC trials—reducing progression risk by 37% versus pembrolizumab alone. This breakthrough positions Arcus as a frontrunner in a $50 billion+ immuno-oncology market, addressing resistance challenges in lung cancer and unlocking potential for broader solid tumor applications amid surging demand for next-gen therapies.
Casdatifan program’s late-stage momentum fuels Arcus’s oncology pipeline growth. With Phase 3 initiation in clear cell renal cell carcinoma (ccRCC) backed by compelling Phase 1b data showing 80% response rates in combination with cabozantinib, casdatifan offers best-in-class HIF-2α inhibition—tapping into a $10 billion RCC market and creating a narrative of precision medicine leadership for genetically driven cancers.
Strategic collaborations with AstraZeneca and Gilead amplify Arcus’s global reach and validation. The expanded AstraZeneca partnership for Phase 3 trials in NSCLC and RCC, alongside Gilead’s $1.5 billion TIGIT option exercise, provide non-dilutive funding and co-development firepower—reinforcing Arcus’s story as a biotech innovator with de-risked assets and accelerated paths to commercialization in high-unmet-need indications.
Robust financial position post-offering supports aggressive pipeline execution. The November 2025 completion of a $269.7 million stock offering extends Arcus’s cash runway into 2028, funding multiple Phase 3 readouts and new indications without immediate dilution pressures—positioning the company to navigate biotech volatility while capitalizing on clinical catalysts in 2026.
Analyst Ratings:
Goldman Sachs: Neutral
Citigroup: Buy
HC Wainwright: Buy
My Action Plan (45% Return Potential)
I am bullish on RCUS above $17.00-$17.50. My upside target is $32.00-$33.00.
Market-Moving Catalysts for the Week Ahead
Holiday Trading Begins
We're entering one of the most bullish periods of the year from a seasonal standpoint. The back-half of November is historically one of the strongest times of the year, and after the turbulence of recent weeks, bulls have this to look forward to.
But this isn't all to look forward to this week, as the Thanksgiving holiday comes around on Thursday here in the United States. It's a day to give thanks for all that we have, but in reality, we should be practicing gratitude much more often than just for a day.
Over the years, I've found it more important to take these rest days when they come. With 24 hour trading coming in the future, we're going to have to find ways to unplug from the markets. That reset is key for keeping a clear and level head.
A Dollar Rebound in 2026?
A rebound in the U.S. dollar during 2026 could prove bullish for domestic stocks by easing several headwinds that weighed on markets in 2025. A stronger dollar typically signals improving U.S. growth expectations and attractive interest-rate differentials, encouraging foreign capital inflows into U.S. assets and supporting higher equity valuations.
It also allows the Federal Reserve to keep cutting rates without fears of currency collapse or imported inflation. For U.S.-centric companies (which dominate the S&P 500), a firmer dollar reduces the translation drag on foreign earnings and calms concerns about competitive devaluation abroad.
And perhaps most importantly, a orderly dollar recovery often coincides with "U.S. exceptionalism" regimes in which domestic stocks outperform global peers, attracting even more allocation toward U.S. equities and creating a self-reinforcing bullish cycle.
Sector & Industry Strength
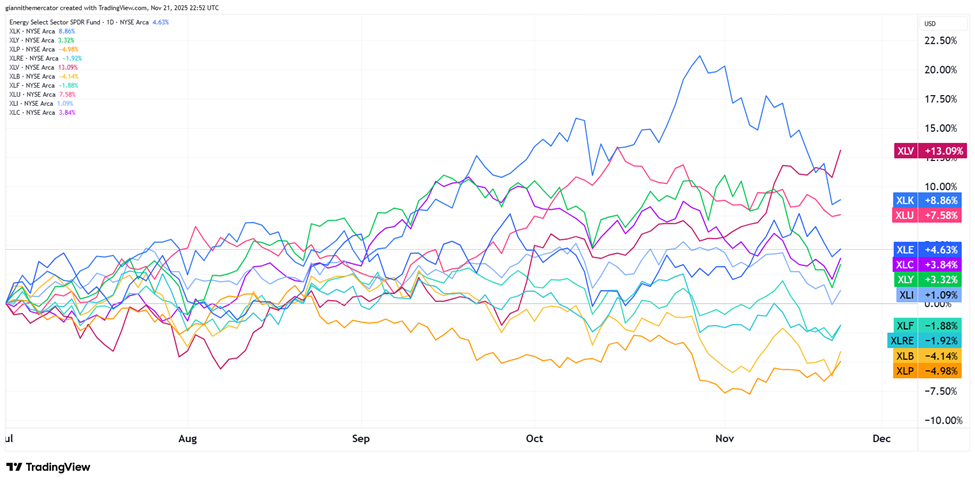
This is the biggest shift I've seen at a sector level in months. Going back to the start of Q3, we now see healthcare (XLV) as the undisputed leader in the S&P, while technology (XLK) has dropped down to third place.
Utilities (XLU) are holding up in second place, so we now have a situation where two defensive sectors in healthcare and utilities are outperforming. This is not a strong signal for bulls in the near-term.
Bulls can rest on the fact that staples (XLP) are still near the bottom of the pack, and it wouldn't take much of a rebound in tech to bring it back into first place. But for now, we're better off exercising patience.
It's no secret that this market lives and dies by the tech sector (XLK). It represents around 30% of the S&P 500 (SPY), so when this sector isn't rising, and more importantly, outperforming, it's going to cause some headwinds.
Fortunately, this only looks to be a temporary bump in the road. The trend in this ratio below is very clearly to the upside, as it's been making higher-highs and higher-lows. We even look to be in the process of forming a higher-low here.
But let's not lose sight of the fact that the ratio broke out from the wedge formation back in the summer. This is a momentum pattern, and so once this pullback in the ratio is over, I'll be looking for tech to reemerge as the big mover in markets.
Is the U.S. the Place to Be Again? (Sector ETF: SPY/VT)
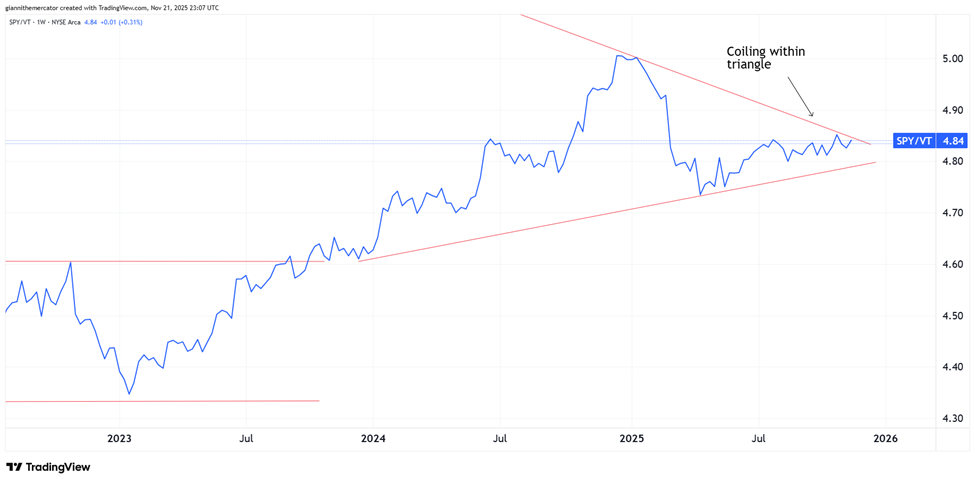
One of the big themes of 2025 was international stocks outperforming U.S. stocks by a wide margin for the first time in many years. However, with the prospect of a big rebound in the Dollar, could we see a reversion back to the trend that's dominated the past several years?
I'm looking at the ratio here between the S&P 500 (SPY) and a total world stock fund (VT). The ratio here is in a broader uptrend, but over the past couple of years, we've seen it consolidate into a symmetrical triangle formation.
I'm watching for a break above the upper trendline of the pattern, as that could lead to a big breakout from the triangle, and point to a continuation in the uptrend. This would lead to a major influx of capital back into the U.S. market.
Stress in Junk (Sector ETF: HYG/IEI)
I want to dive a bit deeper into some key credit ratios, because there's some growing stress that needs to be resolved sooner than later if this rally in stocks is going to continue. Yes, bonds and stocks are connected to one another in such a manner.
I'm looking at the ratio between junk bonds (HYG) and 3-7 Year Treasuries (IEI). The key here is to see HYG outperform IEI. In other words, junk bonds have to outperform Treasuries. This signals confidence from capital markets and strong liquidity conditions.
The ratio is coming back down after testing resistance of a saucer formation. Bigger picture, I think we will see a big breakout next year, but near-term, seeing this ratio drop does raise a cautionary signal. It's probably waiting for a signal from the Fed.
My Take:
Junk bonds have a reputation of trading similar to stocks with respect to volatility. That said, they're still higher up on the capital ladder compared to stocks. Bulls need to see this ratio rebound if stocks are going to see a holiday rally.
The Fed watches ratios like these. In theory, rate cuts would help to ease the difficulty in bond markets and give junk bonds a boost. It looks like we got some favorable rhetoric from Fed officials in the past week too.
Cryptocurrency
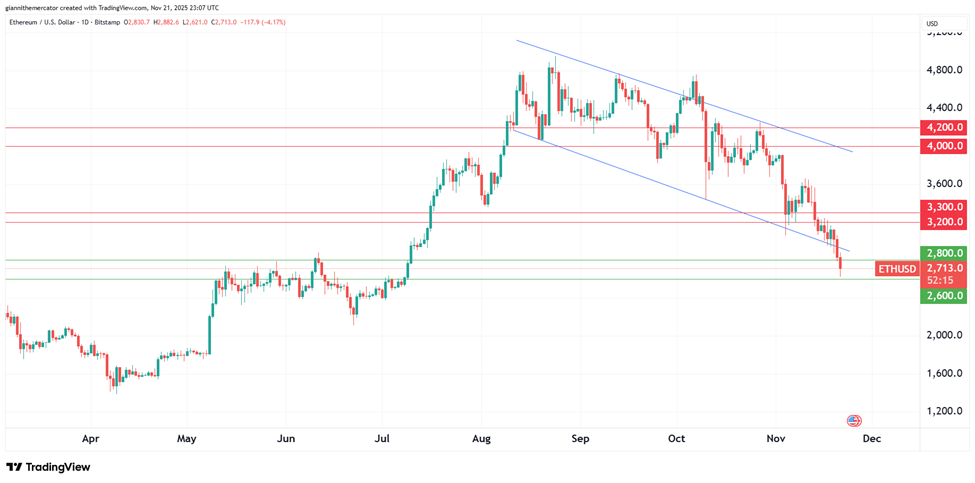
The downward drift in crypto continued last week, and we're still looking for more concrete signs of a bounce. To be clear – it looks like we're closer to the end of this decline than we are the beginning, but we still need to be alert for wide price swings.
Since Ethereum lost the key 3200-3300 level of support, it now becomes resistance. There are some serious technical headwinds now that Ethereum is below this zone. The next level it may test is in the 2600-2800 zone.
I don't think this changes much for the bigger picture in 2026. In fact, I am looking for Ethereum to be back at new all-time highs in 2026, and even testing the 6,000 zone. Let's see if it can get back into the descending channel soon.
Legal Disclosures:
This communication is provided for information purposes only.
This communication has been prepared based upon information, including market prices, data and other information, from sources believed to be reliable, but Benzinga does not warrant its completeness or accuracy except with respect to any disclosures relative to Benzinga and/or its affiliates and an analyst’s involvement with any company (or security, other financial product or other asset class) that may be the subject of this communication. Any opinions and estimates constitute our judgment as of the date of this material and are subject to change without notice. Past performance is not indicative of future results. This communication is not intended as an offer or solicitation for the purchase or sale of any financial instrument. Benzinga does not provide individually tailored investment advice. Any opinions and recommendations herein do not take into account individual client circumstances, objectives, or needs and are not intended as recommendations of particular securities, financial instruments or strategies to particular clients. You must make your own independent decisions regarding any securities, financial instruments or strategies mentioned or related to the information herein. Periodic updates may be provided on companies, issuers or industries based on specific developments or announcements, market conditions or any other publicly available information. However, Benzinga may be restricted from updating information contained in this communication for regulatory or other reasons. Clients should contact analysts and execute transactions through a Benzinga subsidiary or affiliate in their home jurisdiction unless governing law permits otherwise.
This communication may not be redistributed or retransmitted, in whole or in part, or in any form or manner, without the express written consent of Benzinga. Any unauthorized use or disclosure is prohibited. Receipt and review of this information constitutes your agreement not to redistribute or retransmit the contents and information contained in this communication without first obtaining express permission from an authorized officer of Benzinga. Copyright 2022 Benzinga. All rights reserved.