Seller Fatigue Builds As Bitcoin Stabilizes From Oversold Levels
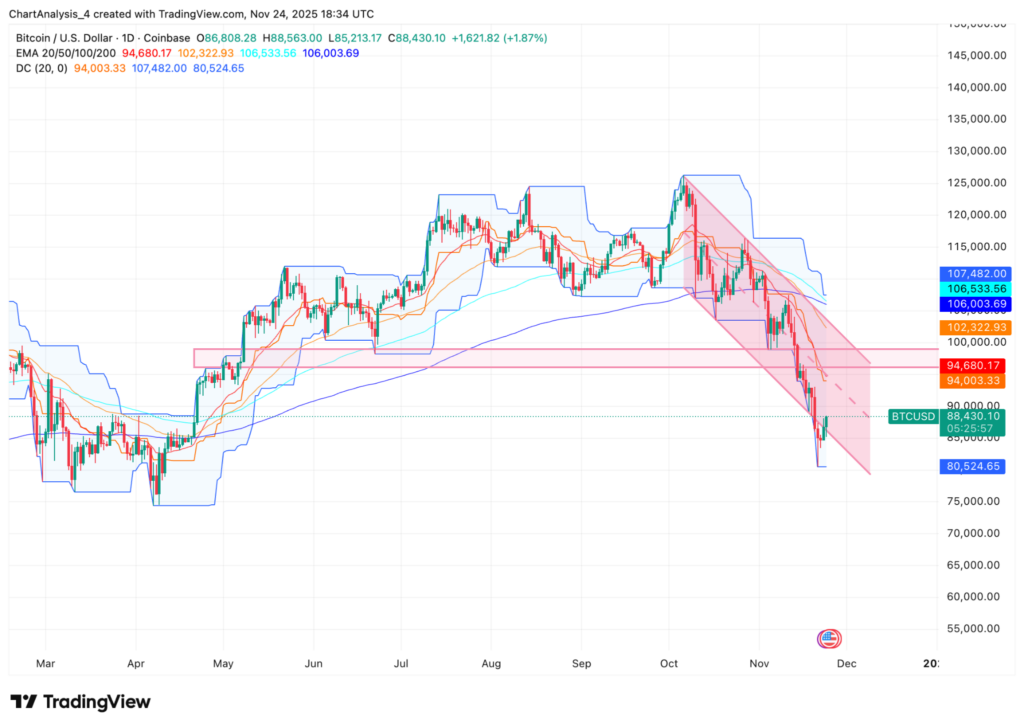
Glassnode's latest weekly report detailed how Bitcoin's drop below $90,000 and brief slide to $80,500 pushed momentum indicators into extreme oversold territory.
The firm noted the 14-day RSI fell to 18.8, one of its lowest readings of the year, suggesting downward momentum is beginning to weaken.
Spot behavior supports the shift. Spot CVD improved from –$530 million to –$216 million, indicating fewer aggressive sell orders.
Spot volume rose 11.6% as traders reassessed positioning around the mid-$80,000 region.
Glassnode said these dynamics align with conditions typically seen in the late stages of corrective phases.
Derivatives Markets Still Lean Defensive
Open interest in futures fell 5 percent, reflecting position unwinds rather than new short exposure.
Funding rates dropped further, showing weaker demand for leveraged longs, indicating bulls are no longer paying up to stay long.
Perpetual CVD stayed negative, meaning sellers still dominate market orders.
Options volatility spread jumped from 10.9 percent to 17.4 percent, while 25-delta skew moved above its high band, signaling strong demand for downside protection.
Options open interest remained steady, which Glassnode interpreted as caution rather than speculative expansion.
ETF flows worsened with $1.9 billion in weekly net outflows, one of the weakest readings in months.
Trading volume of ETFs jumped 47.5% to $40 billion as volatility attracted heavier activity.
Glassnode said these trends show institutional sentiment shifting toward more defensive positioning in response to price stress and derivatives-market weakness.
On-Chain Fundamentals Still Subdued
Active addresses increased slightly, while transfer volume almost doubled to $16.1 billion, driven by large reallocations rather than retail speculation.